27 Harrison Street, New York, NY, 10013
Beds
4 bedroomsBaths
4.5 bathroomsSq. Feet
4,000 sq. feetBuilt
Built: 1940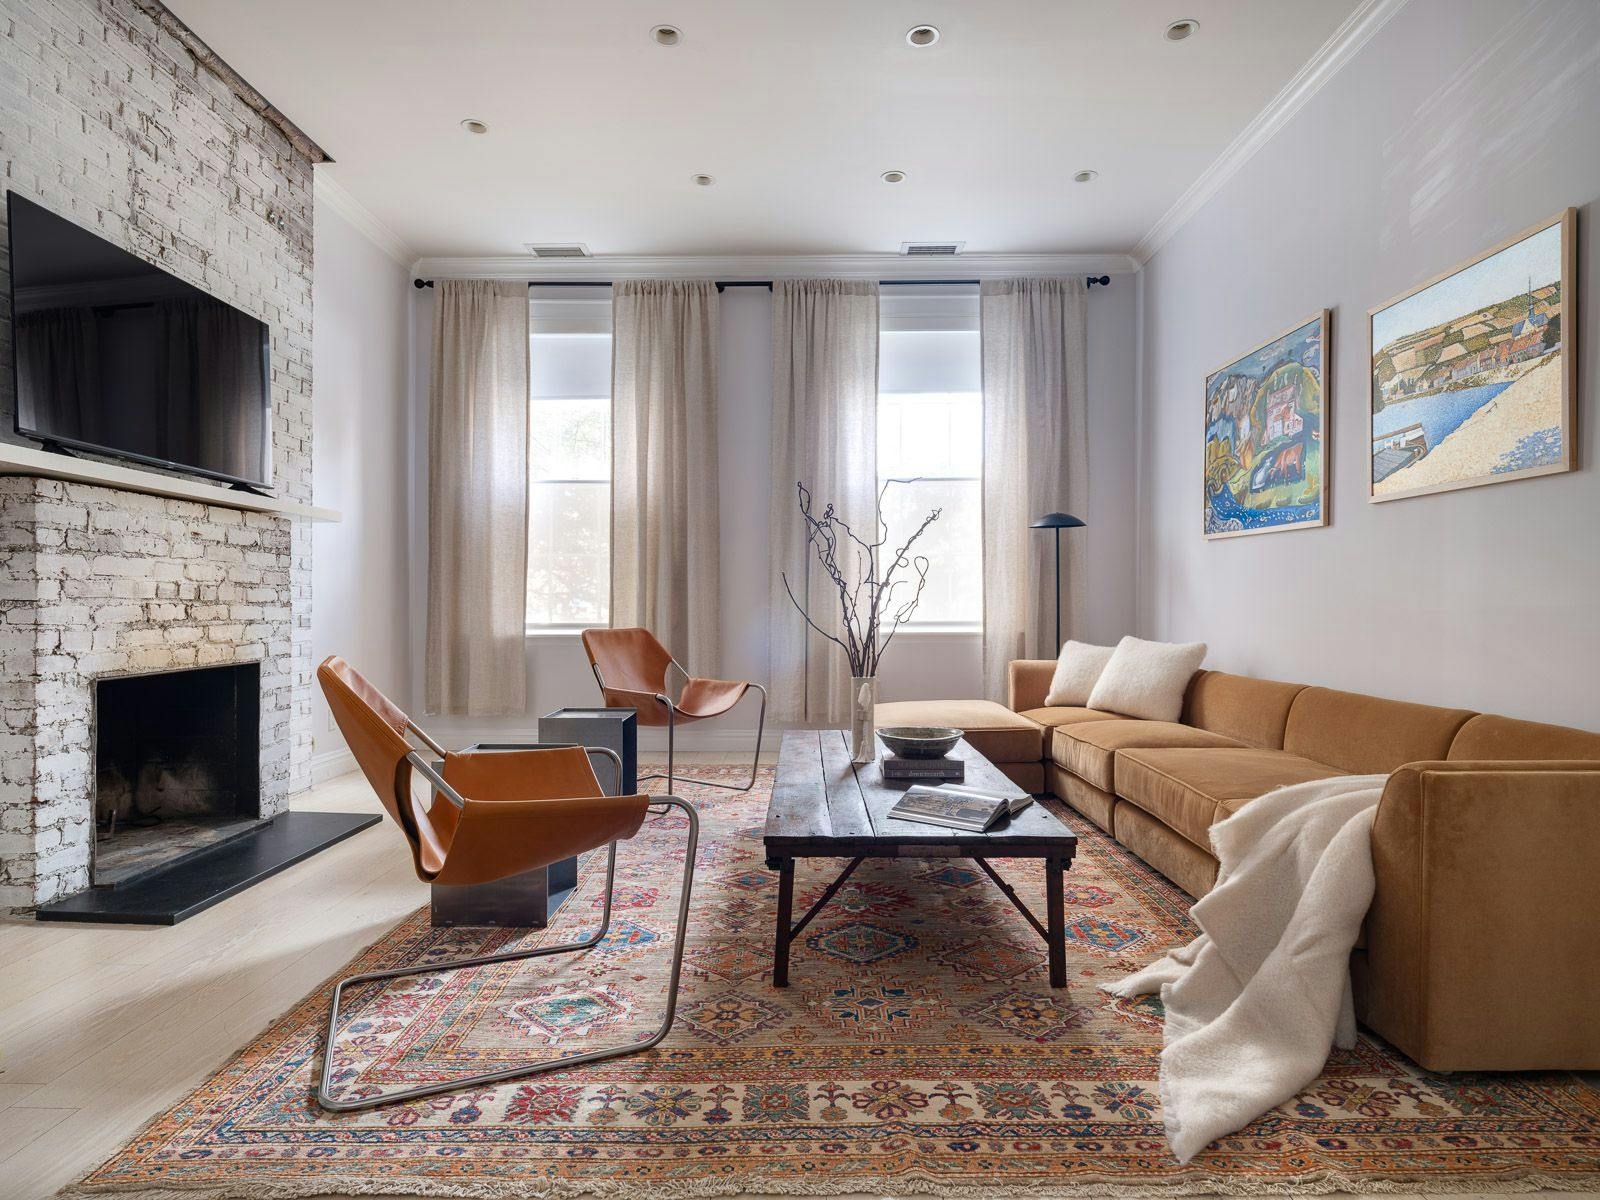
Price
$6,750,000
Cap Rate
3.5%
Revenue Potential
$356K
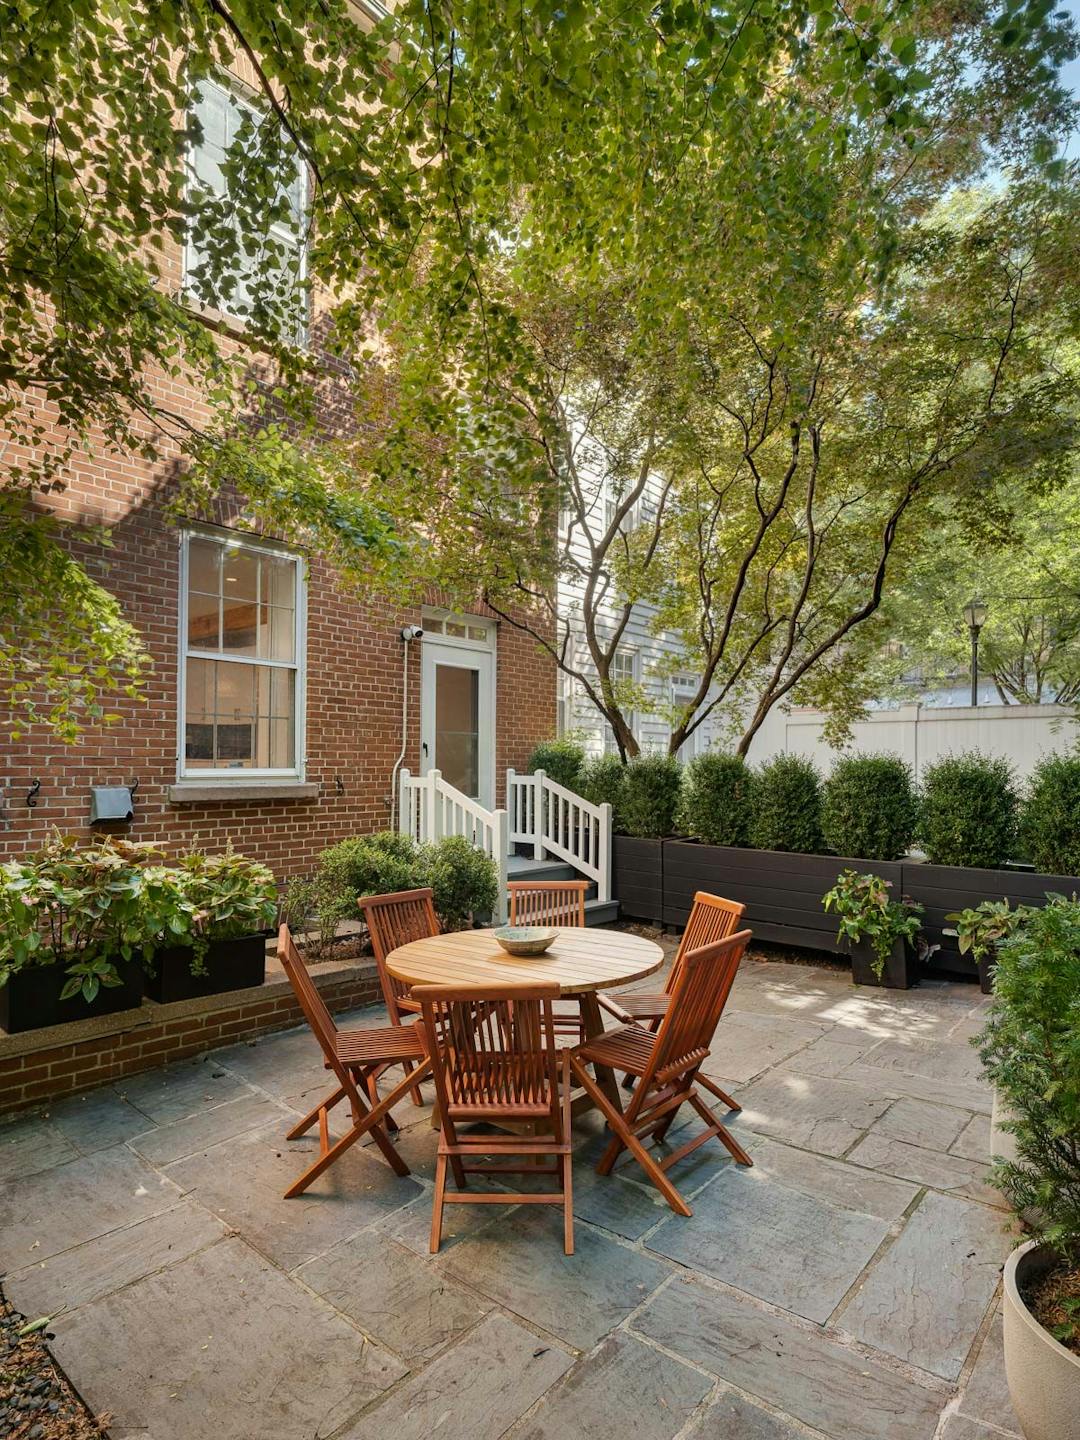
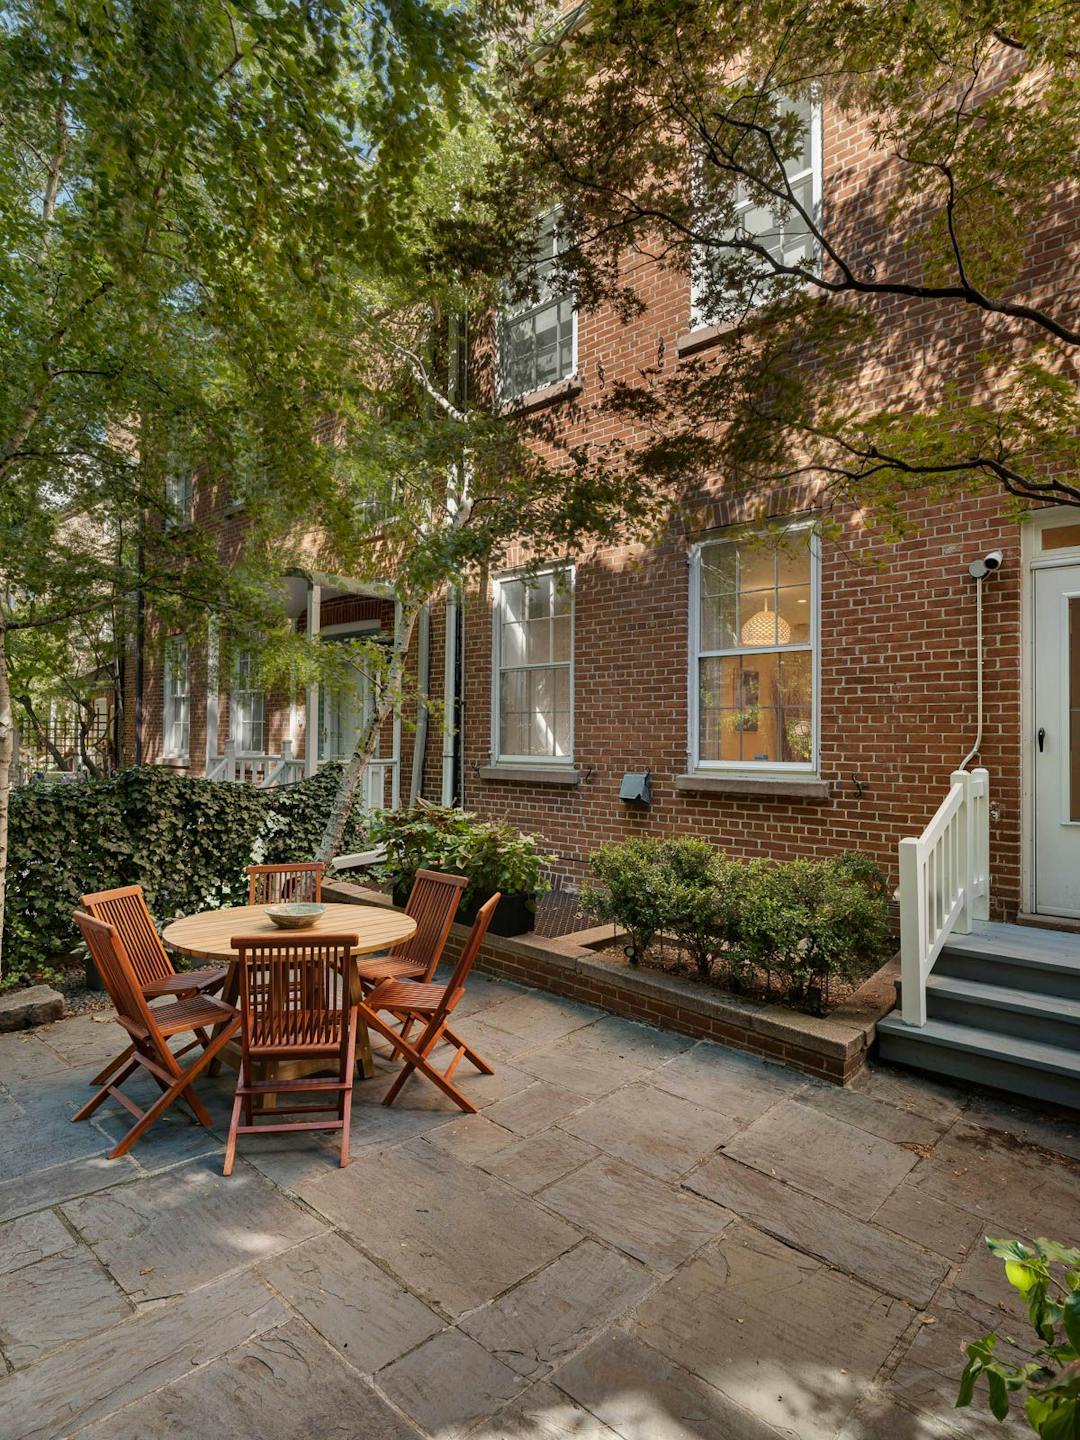
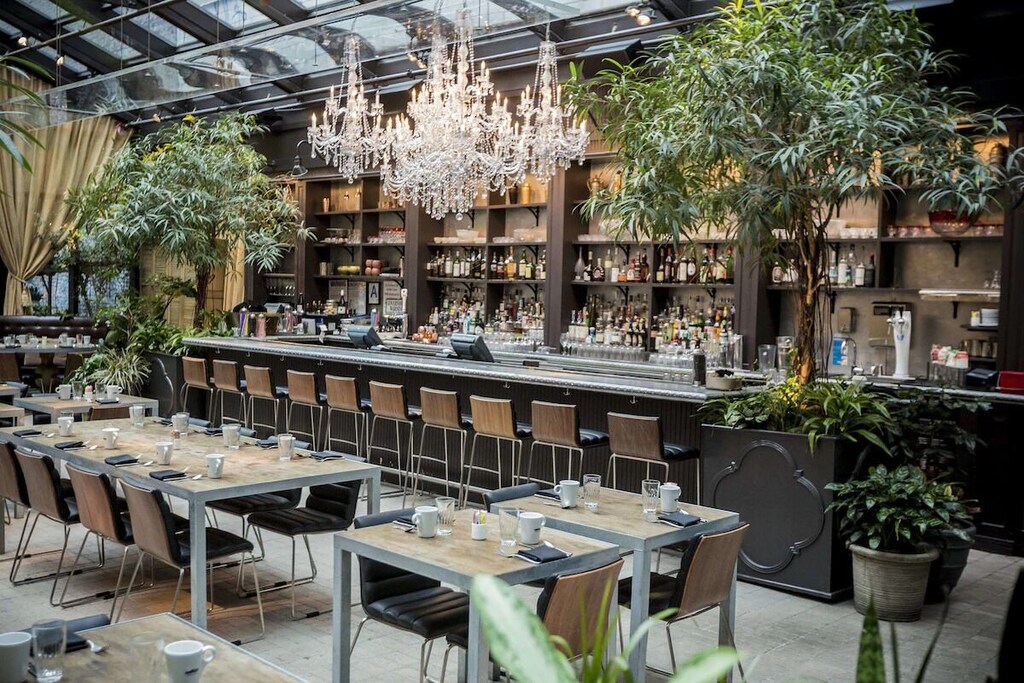
Amazing Location
One of a row of townhouses on a tree-lined picturesque street in the heart of Tribeca is perfectly positioned moments from the Hudson River Park surrounded by all the conveniences of the inimitable Tribeca lifestyle.
Rich History
John McComb Jr. - the architect of City Hall - built this house in 1796, moving it from its original site to the current location. It was designated a landmark in 1969 and might be amongst the oldest houses in New York City that has been meticulously gut-renovated in recent years.
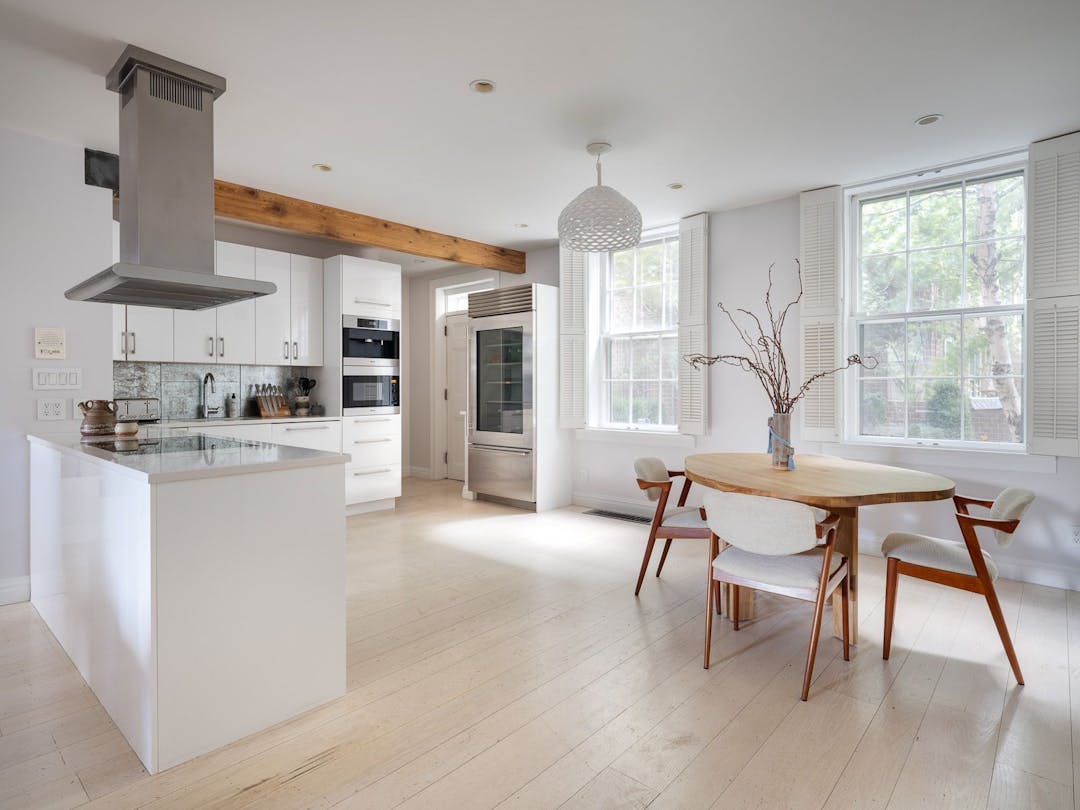
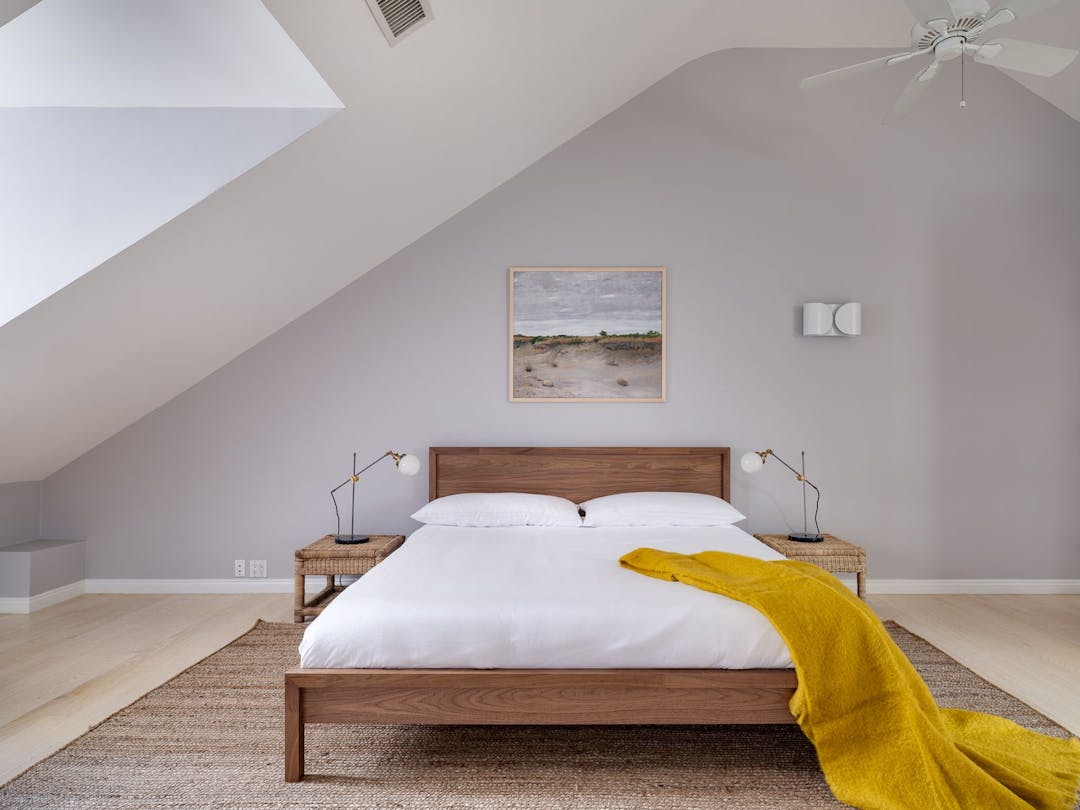
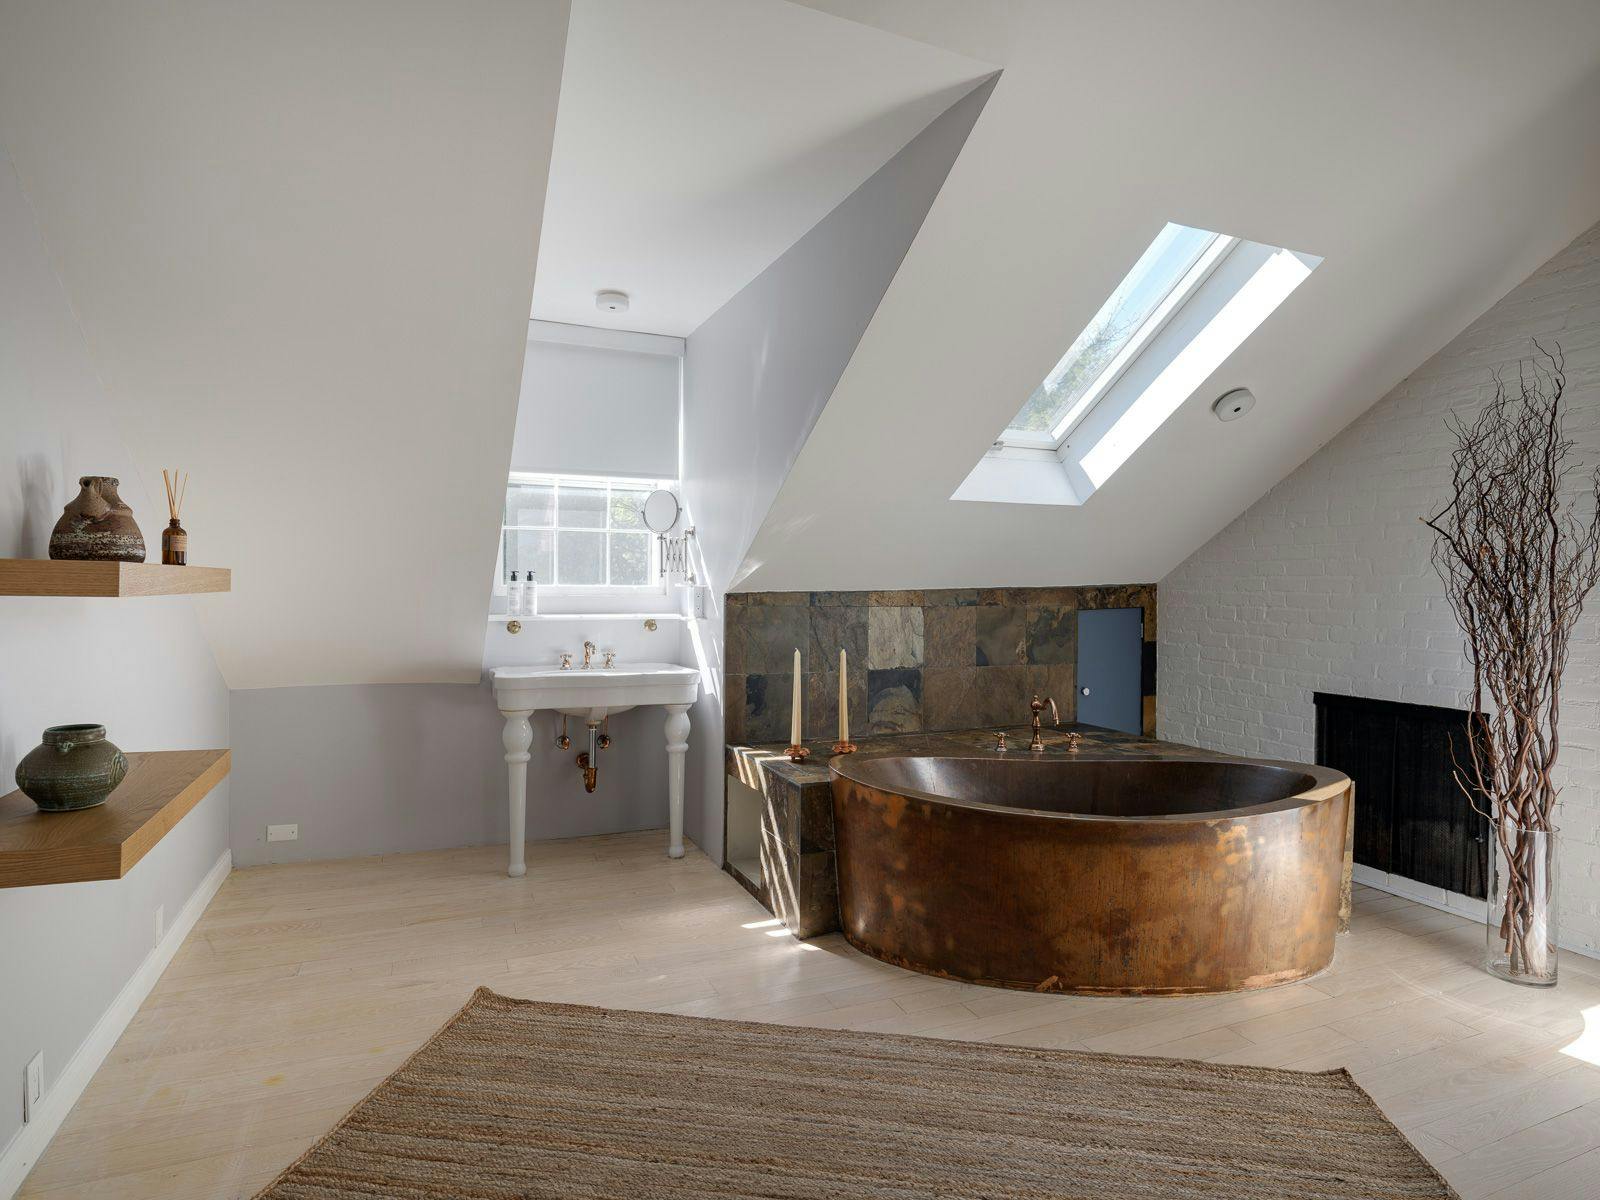
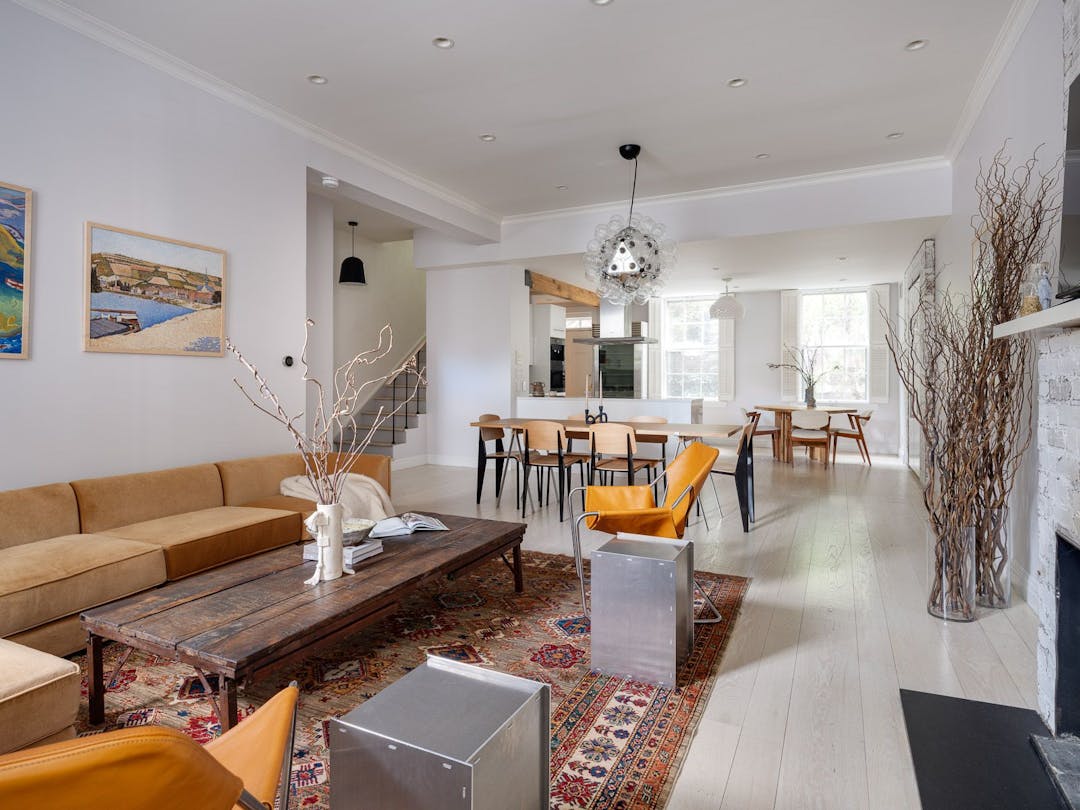
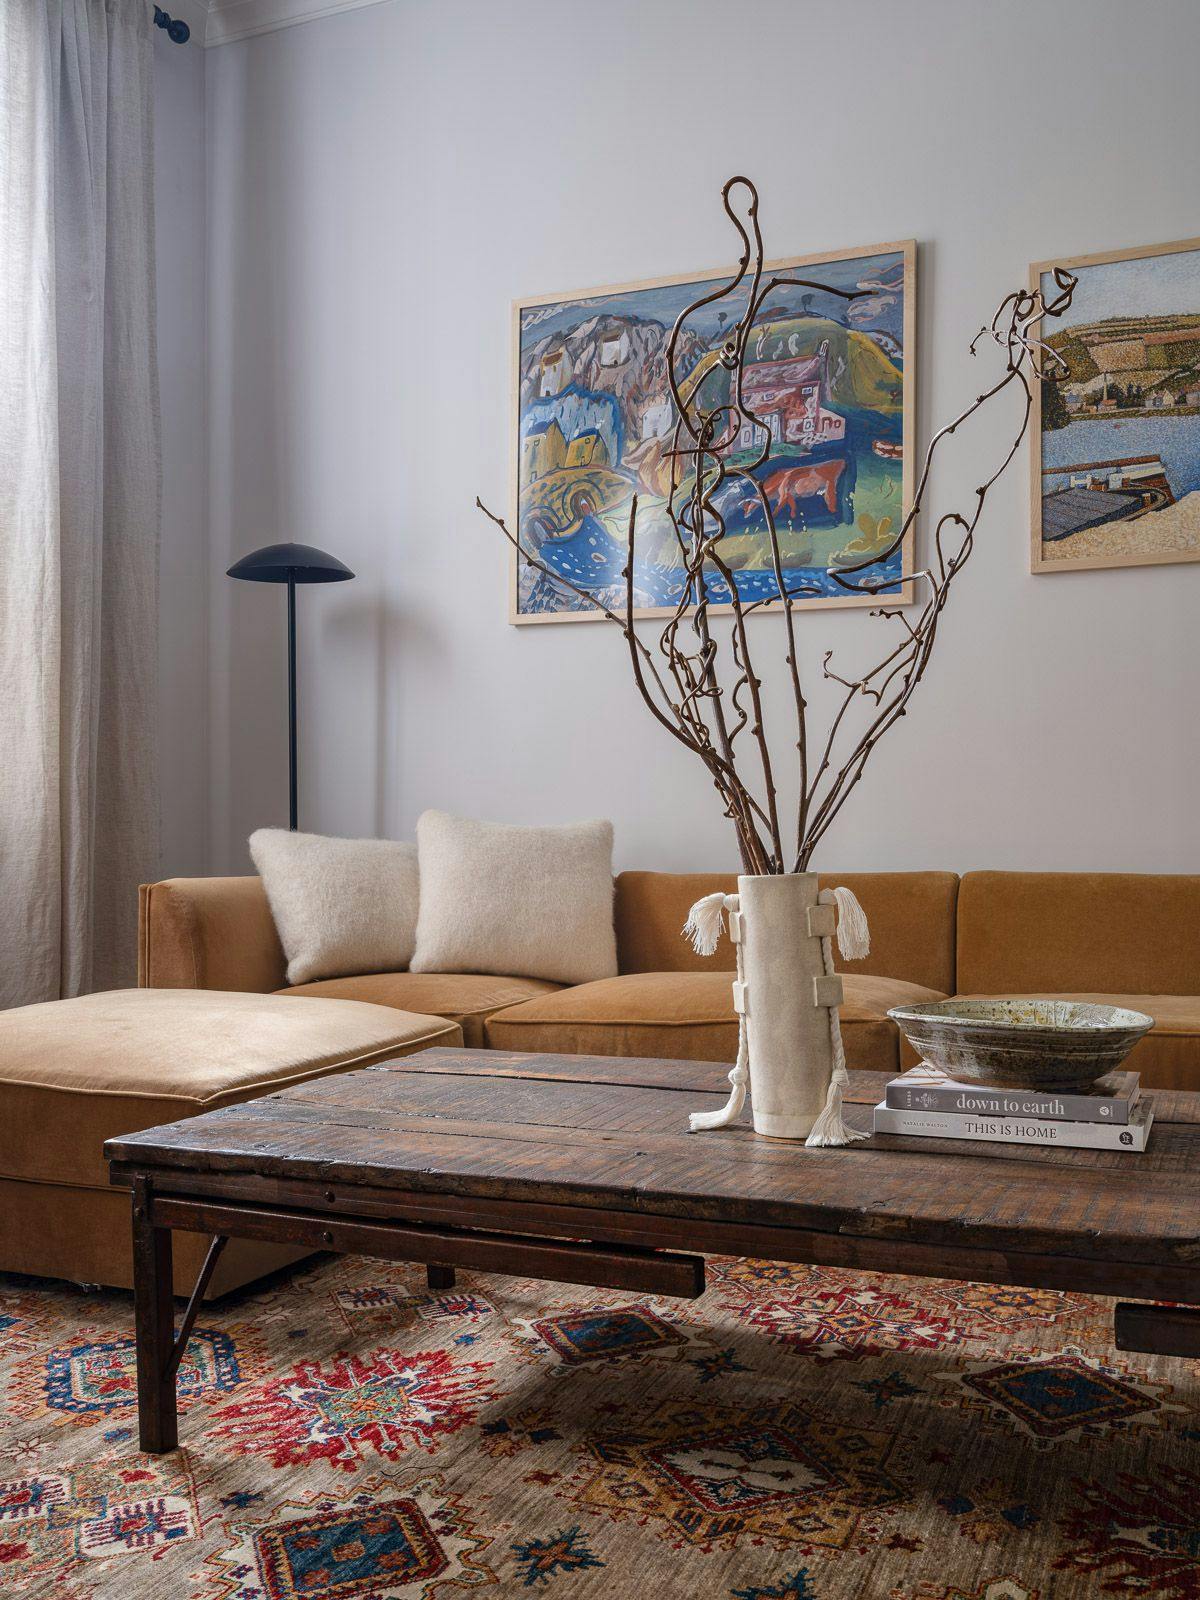
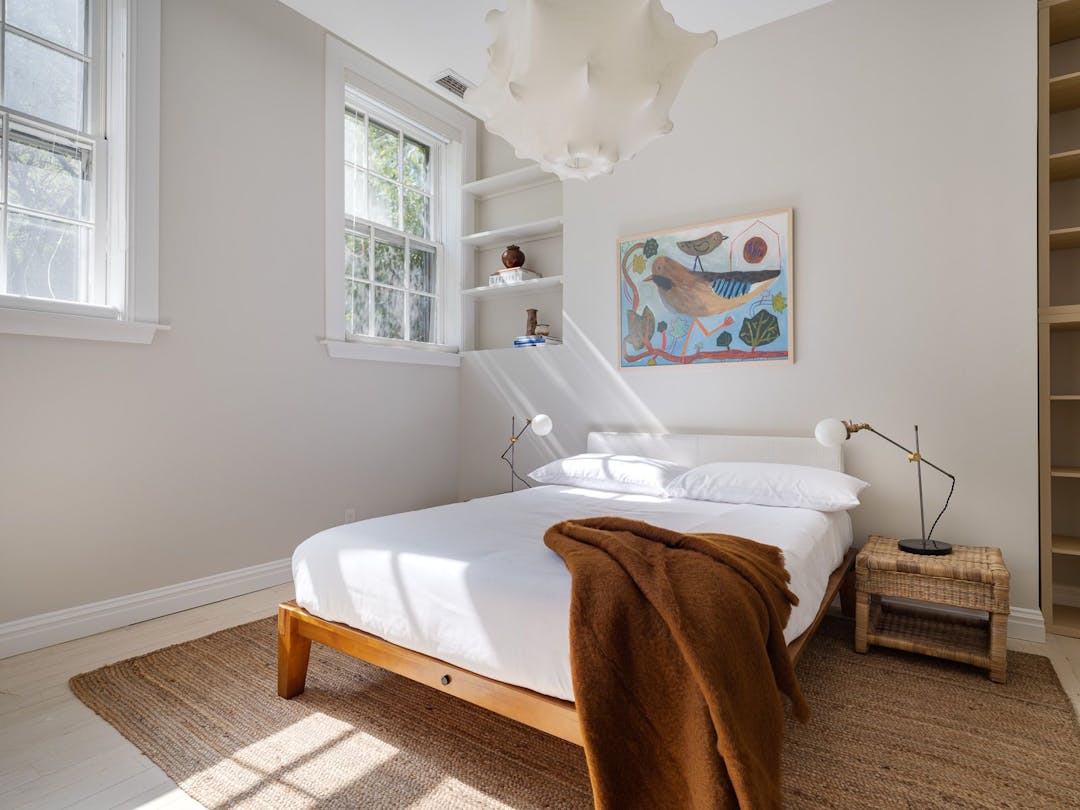
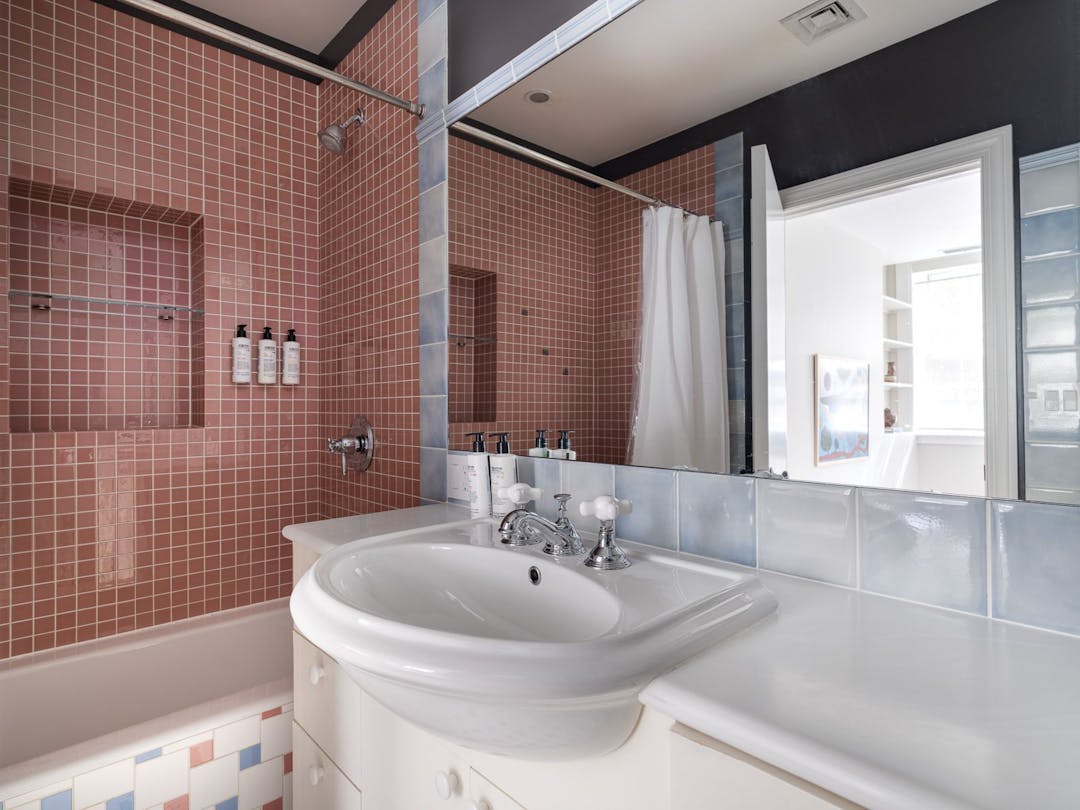
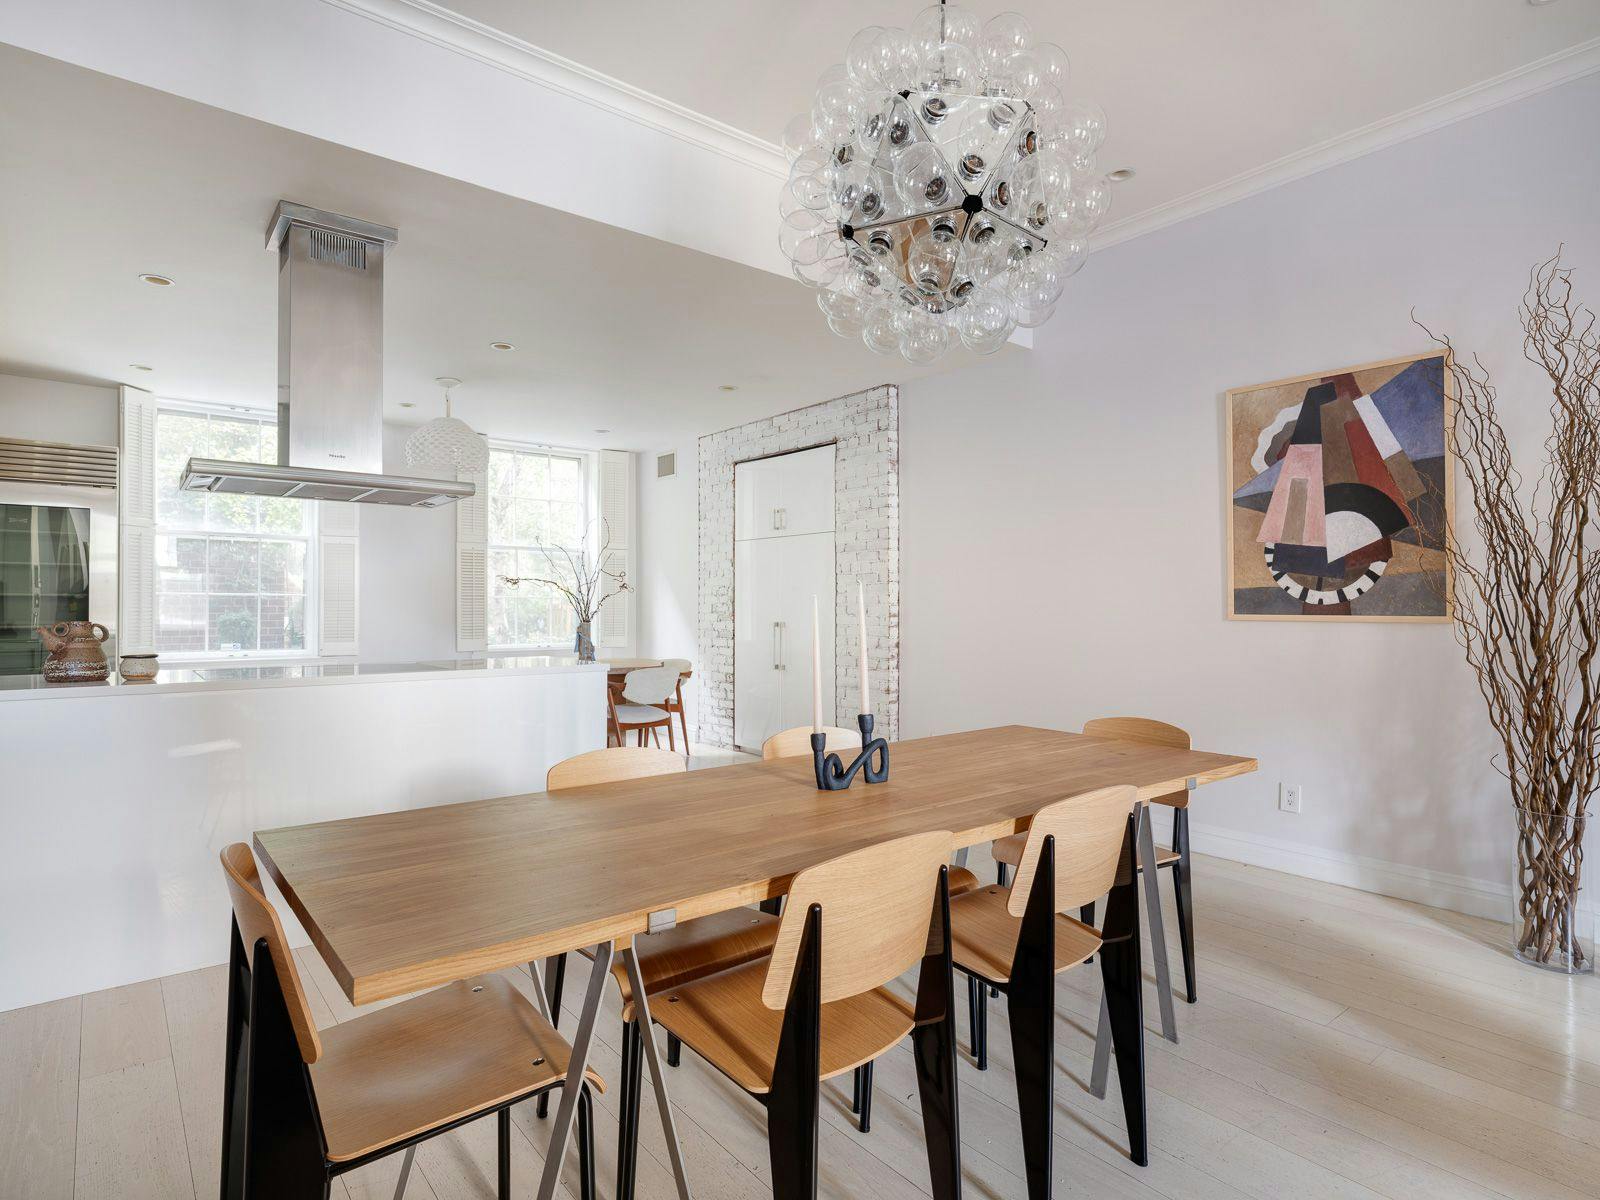
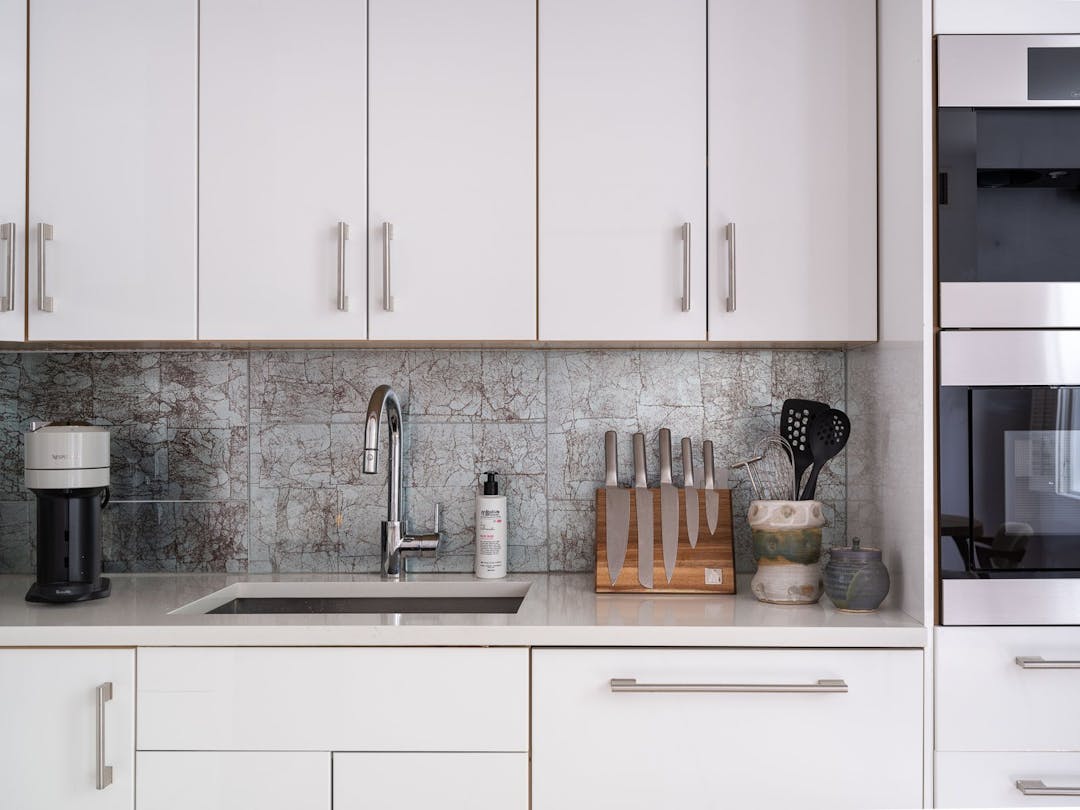
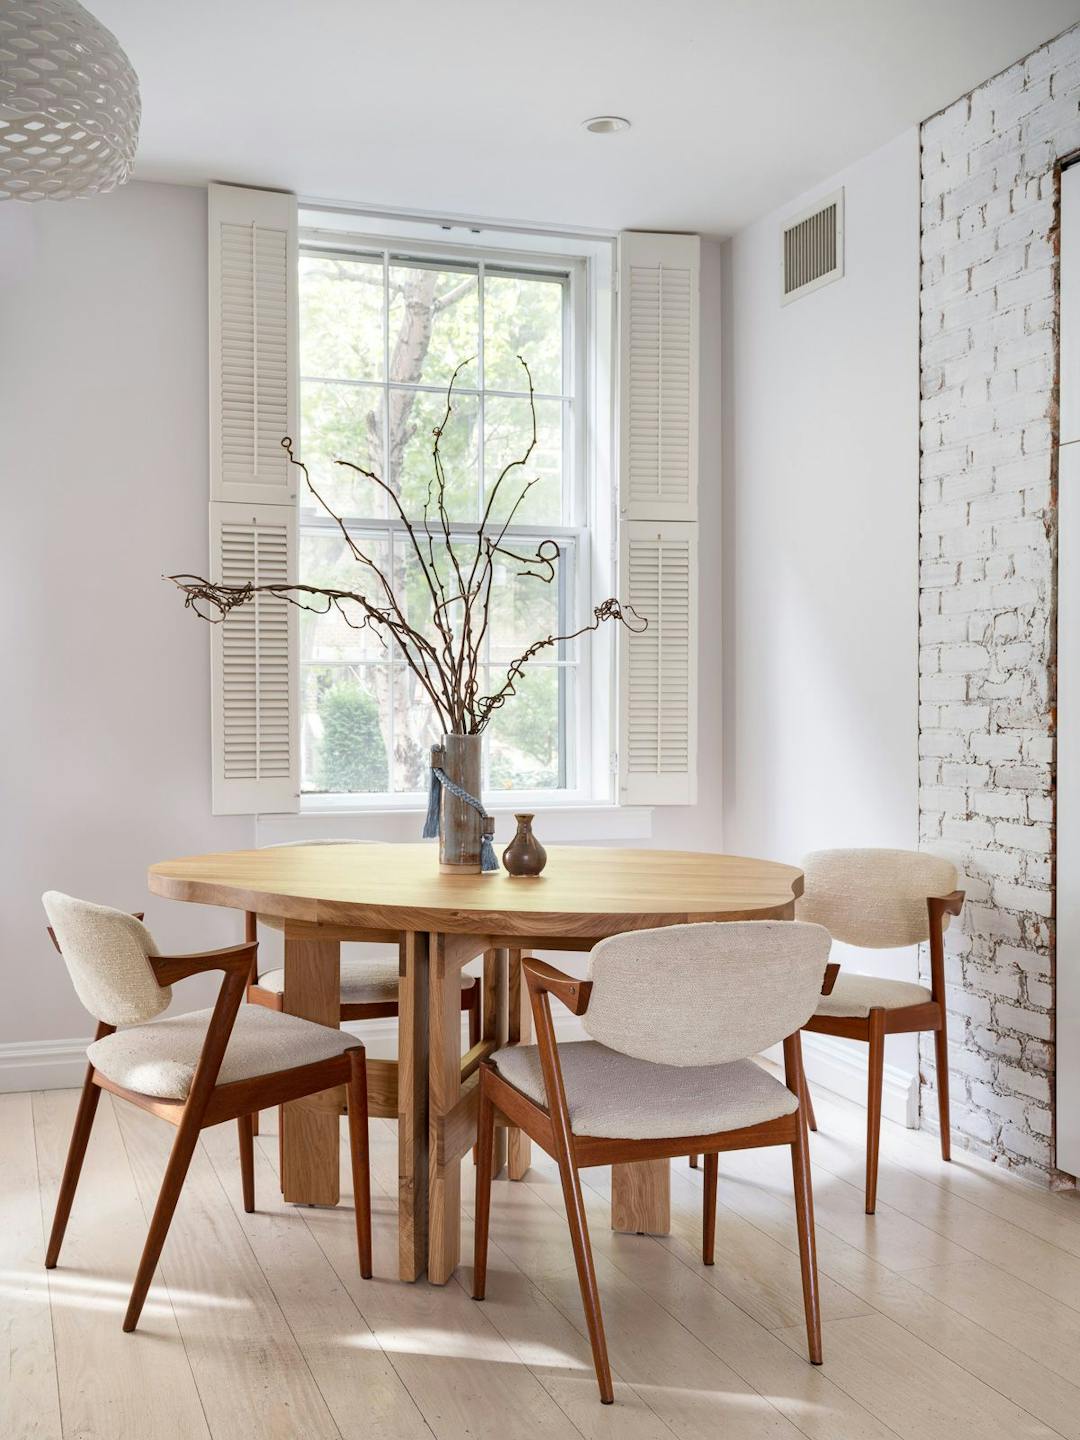
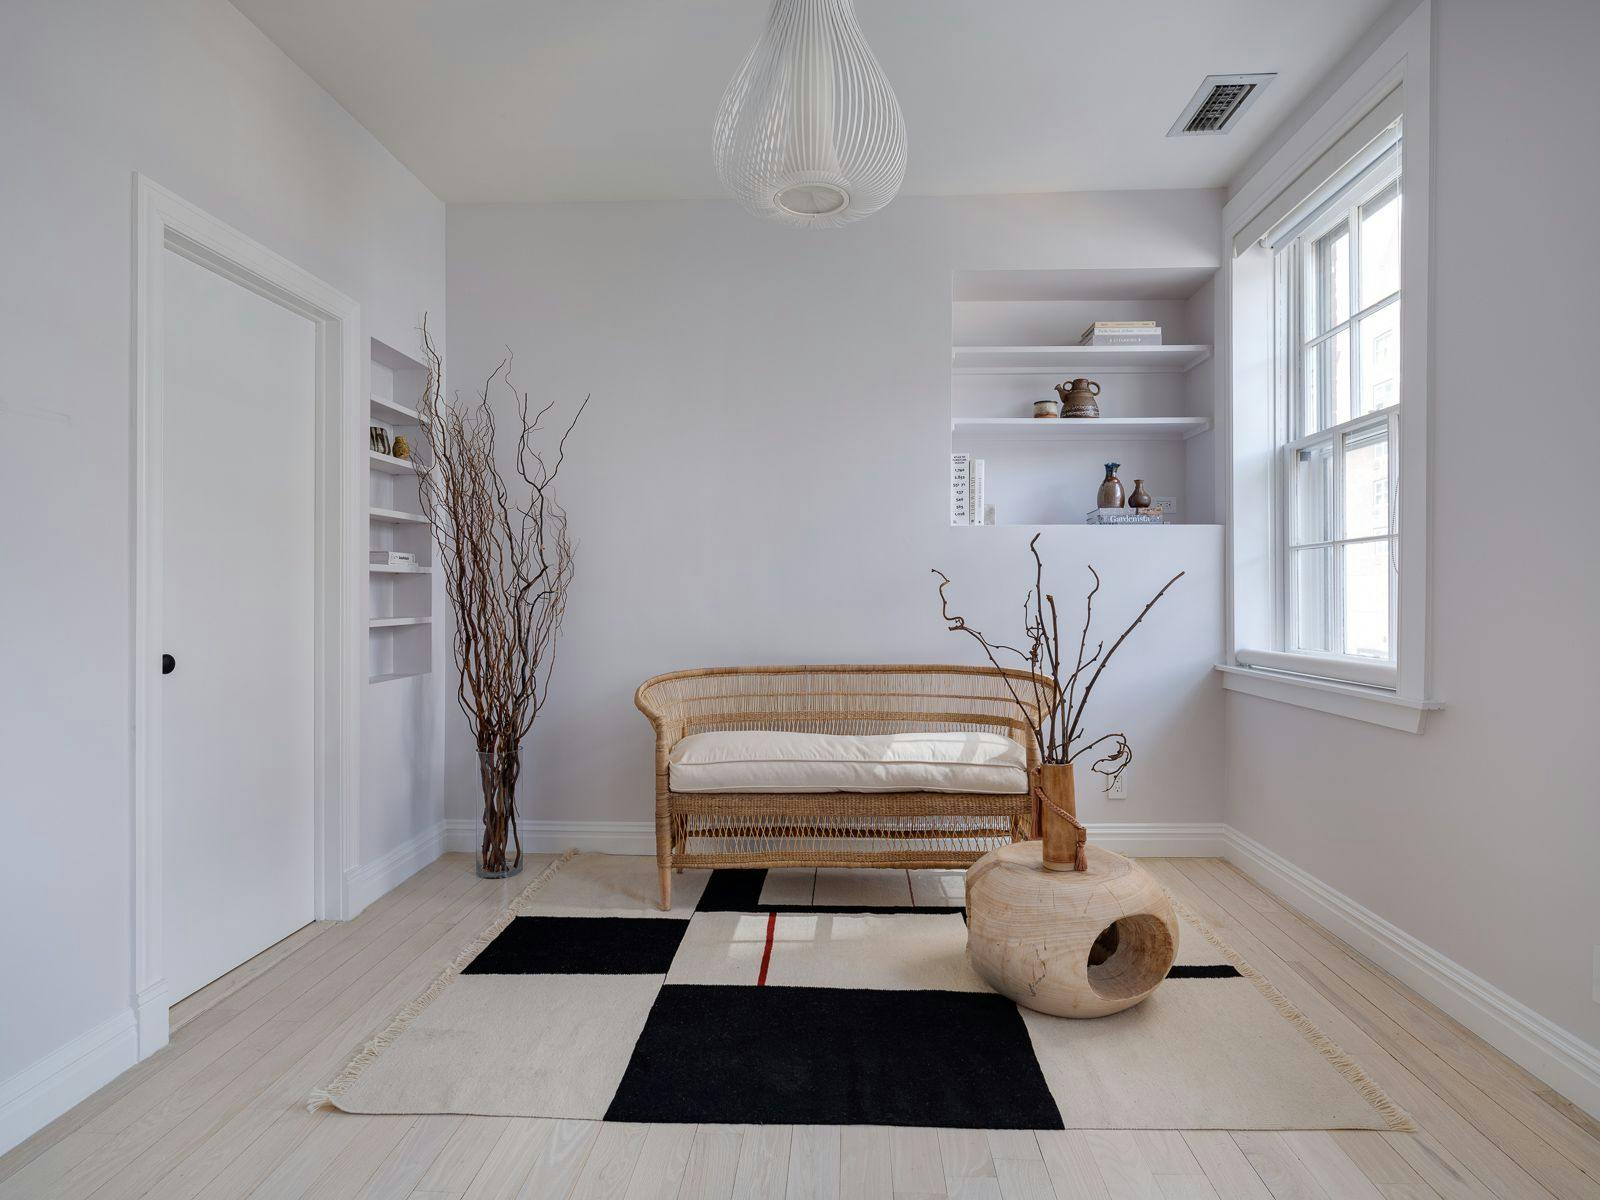
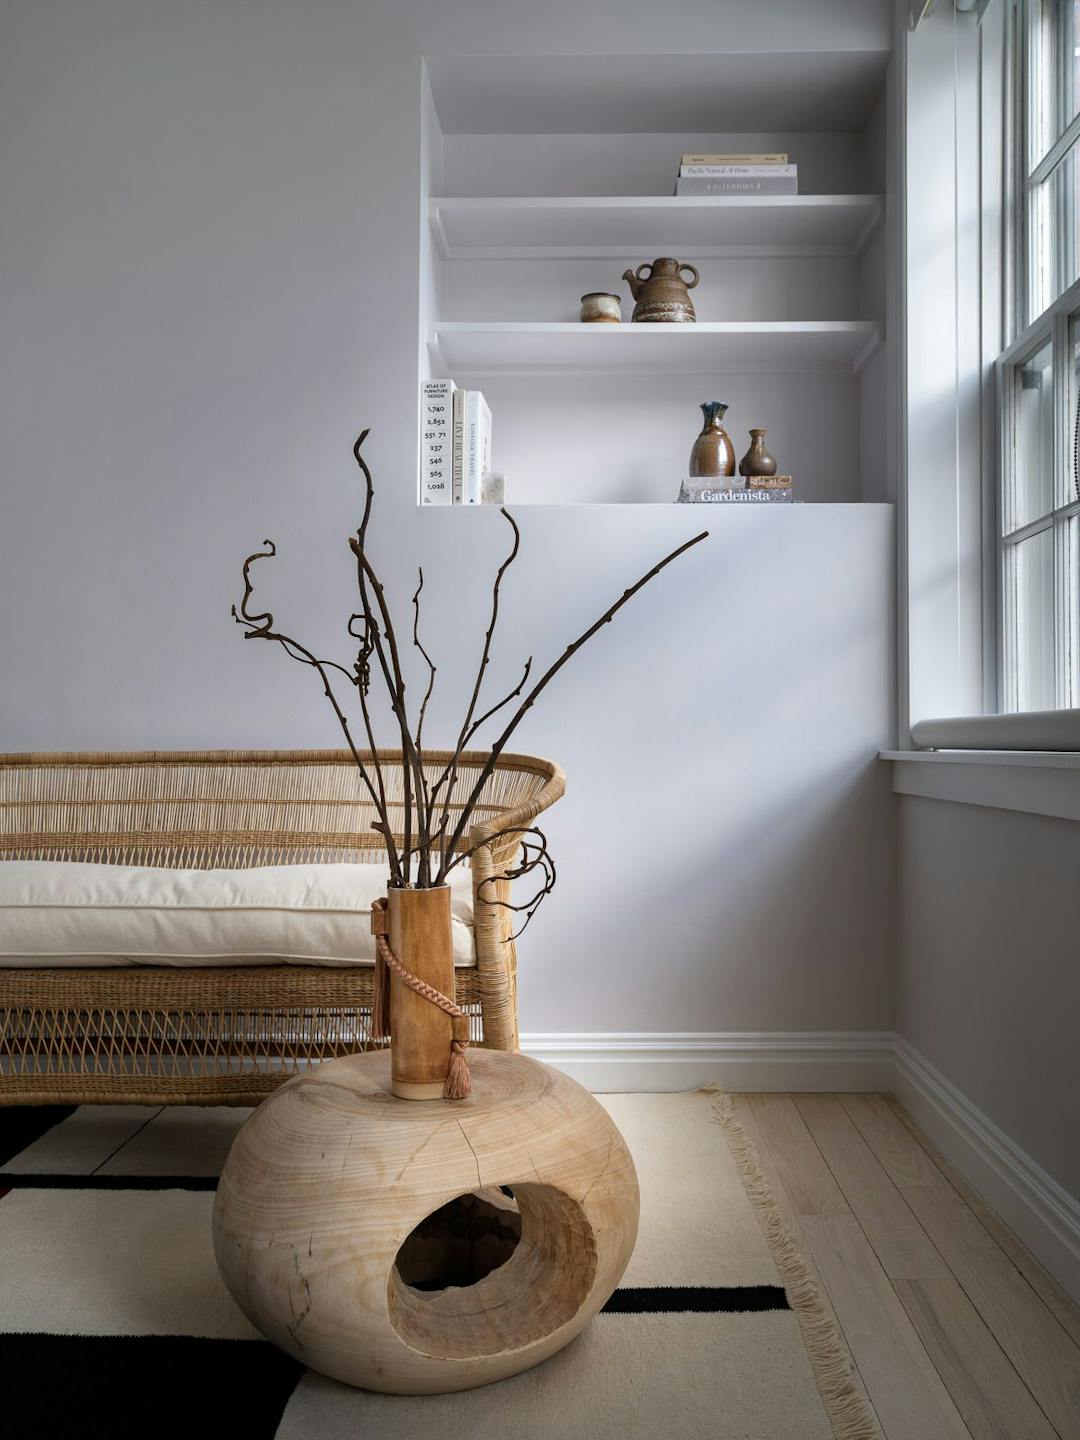
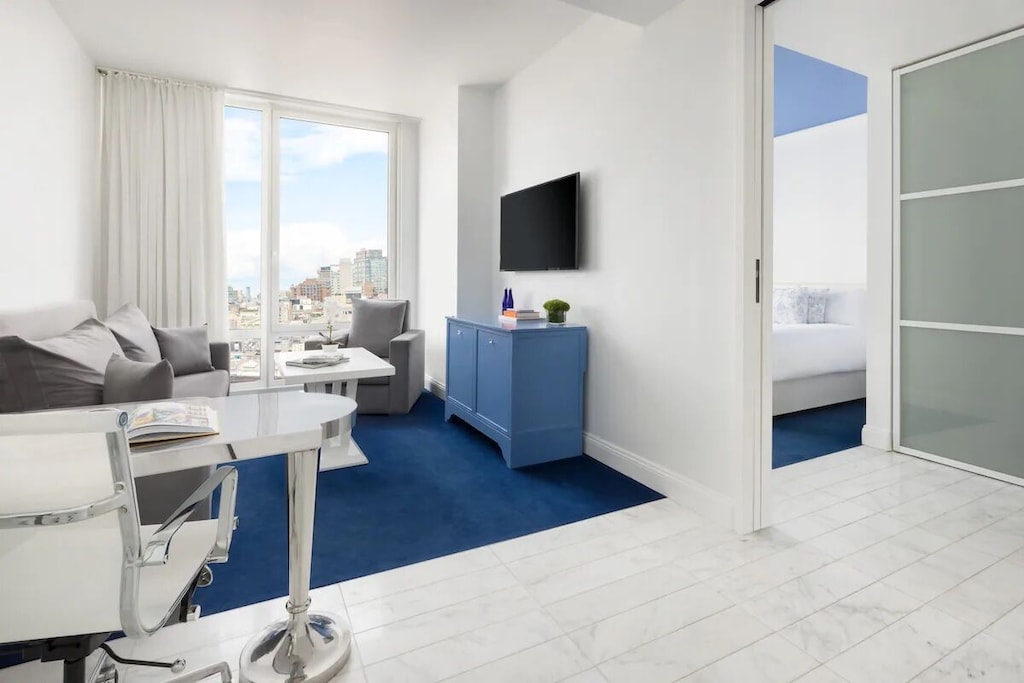
Beautiful Finishes
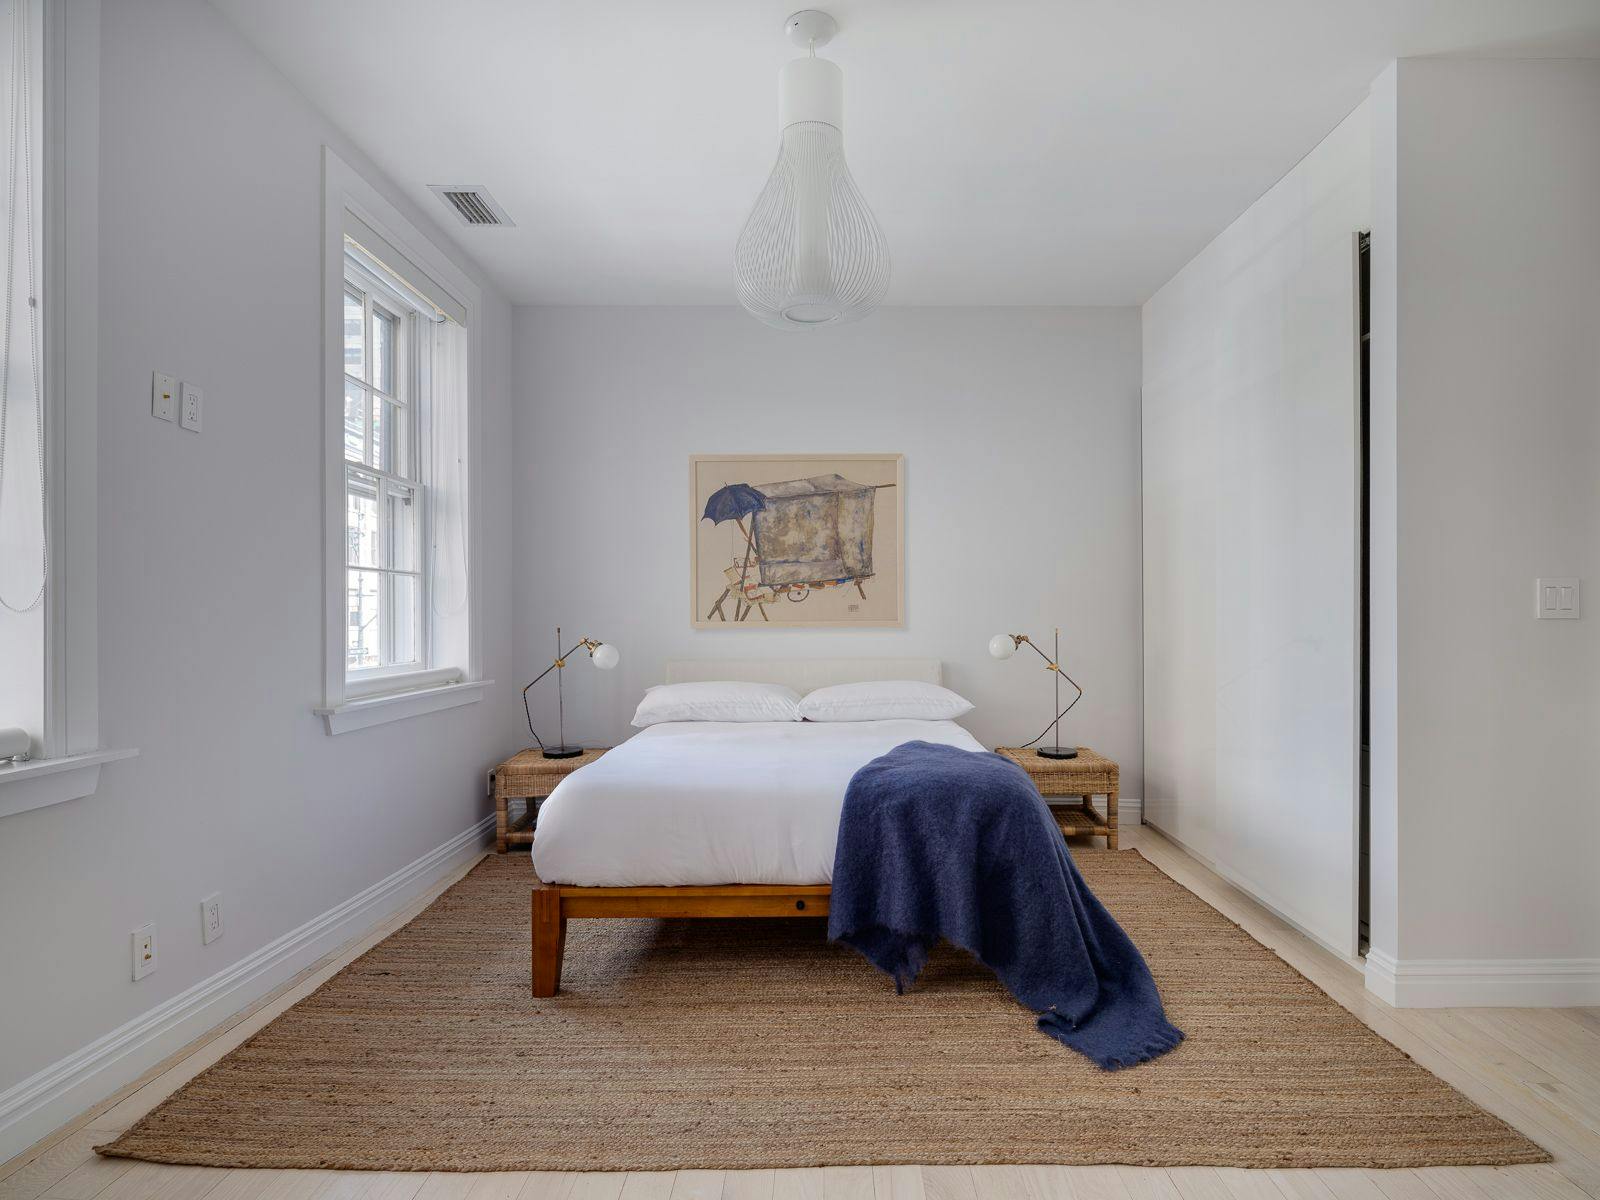
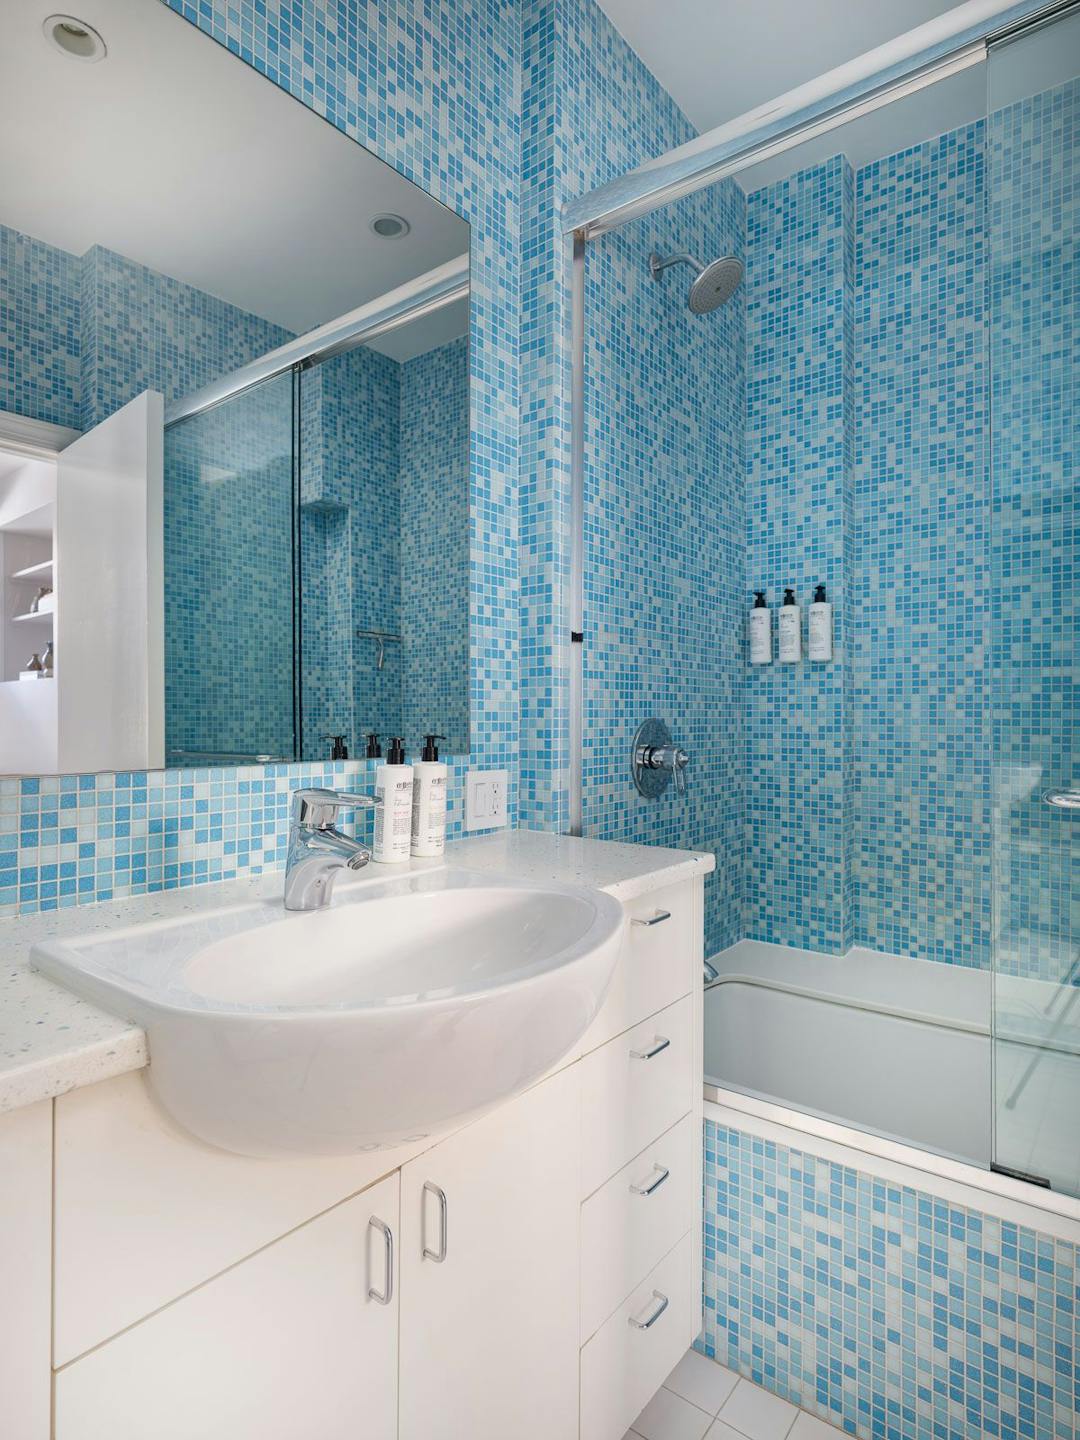
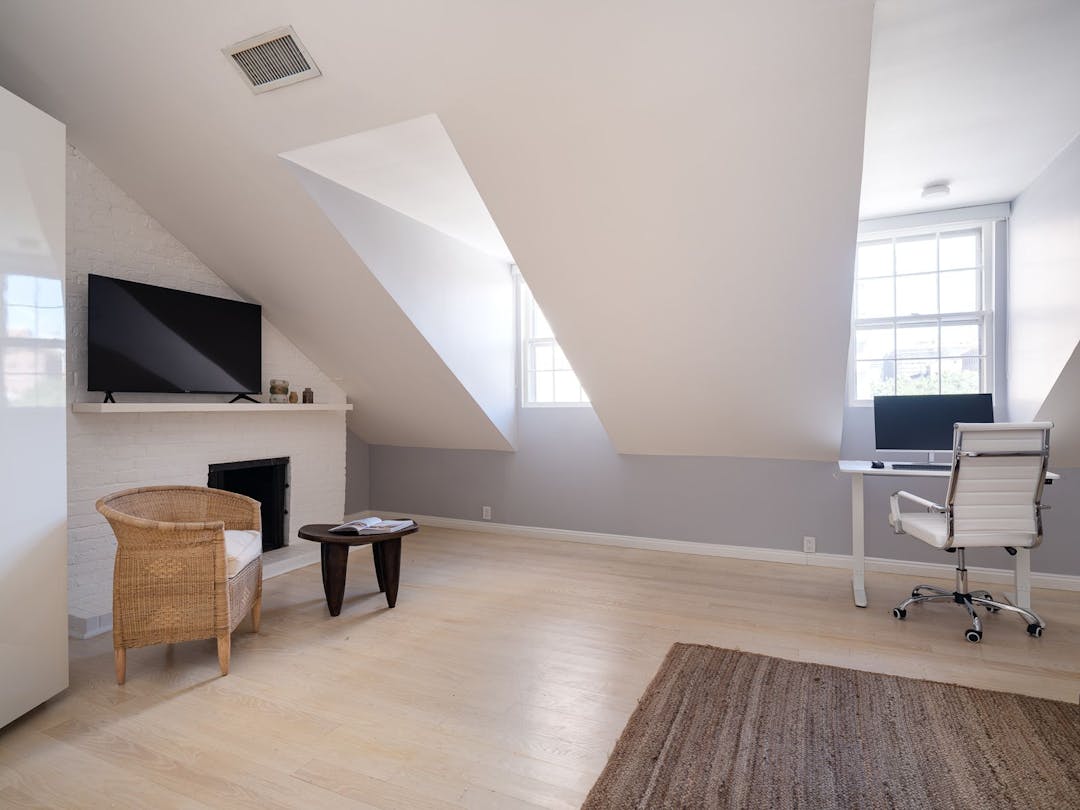
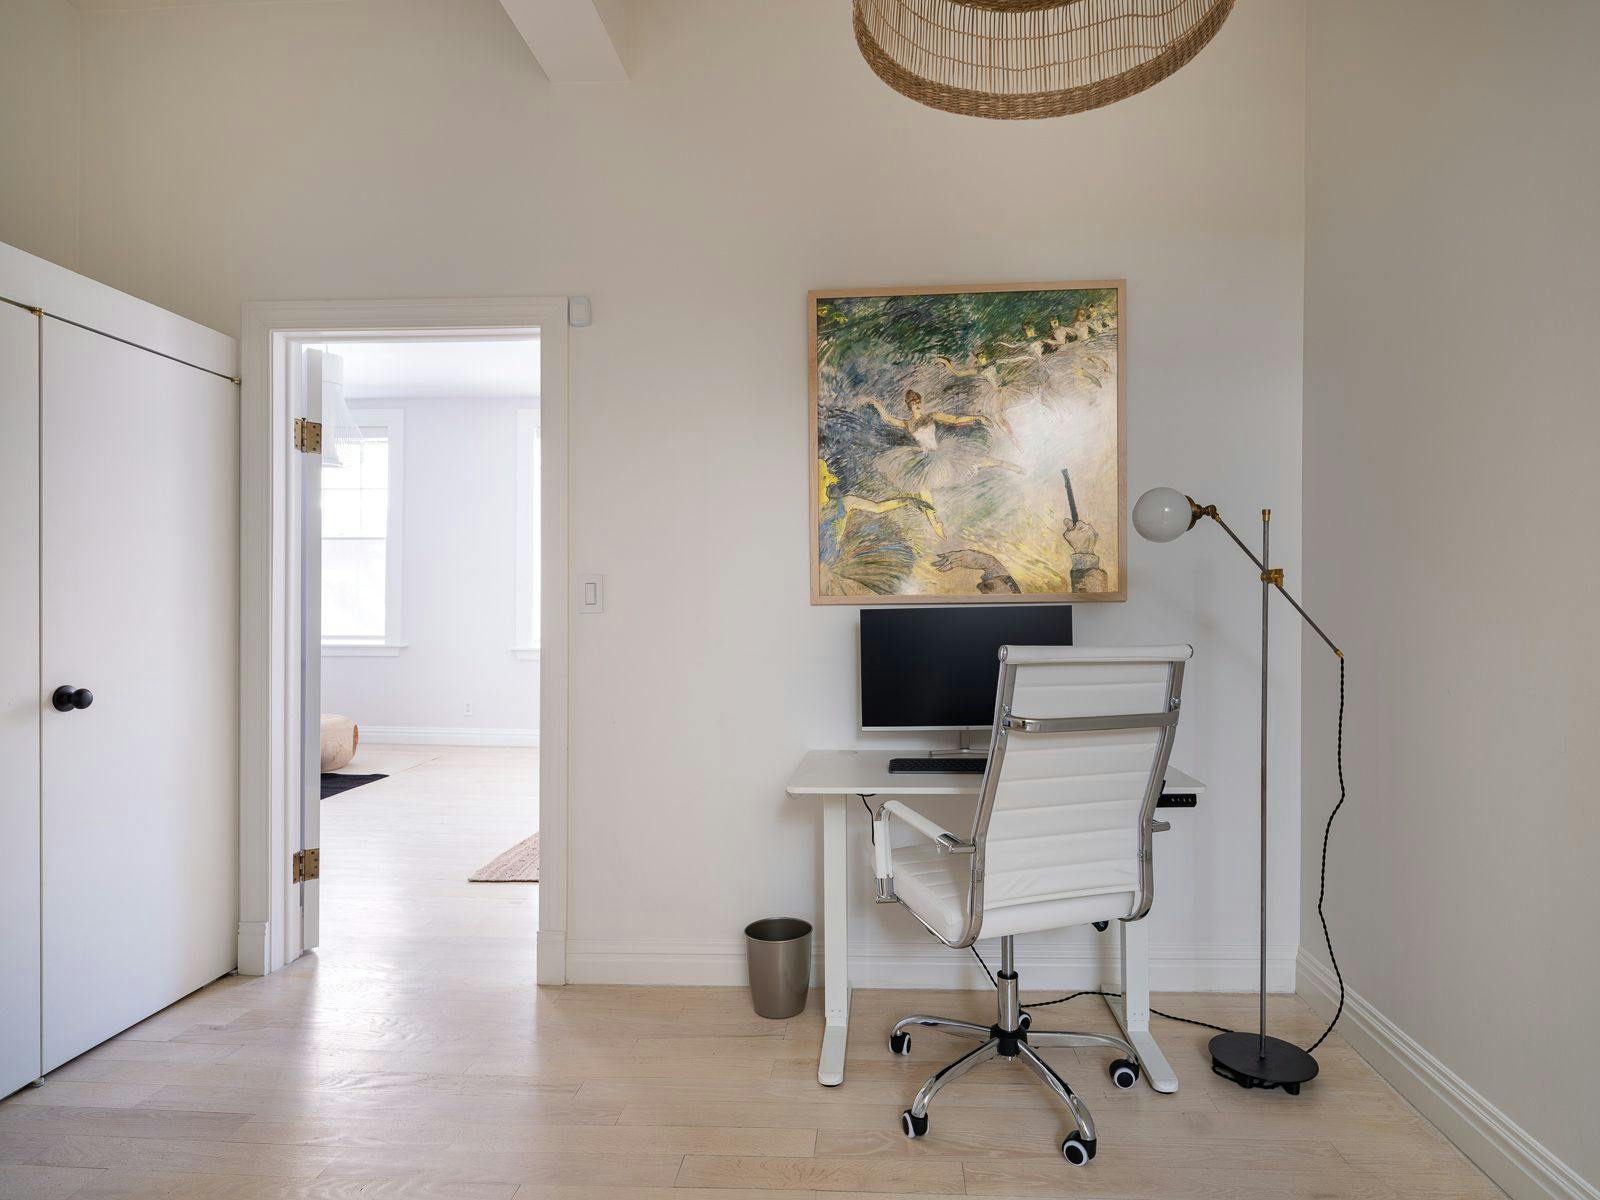
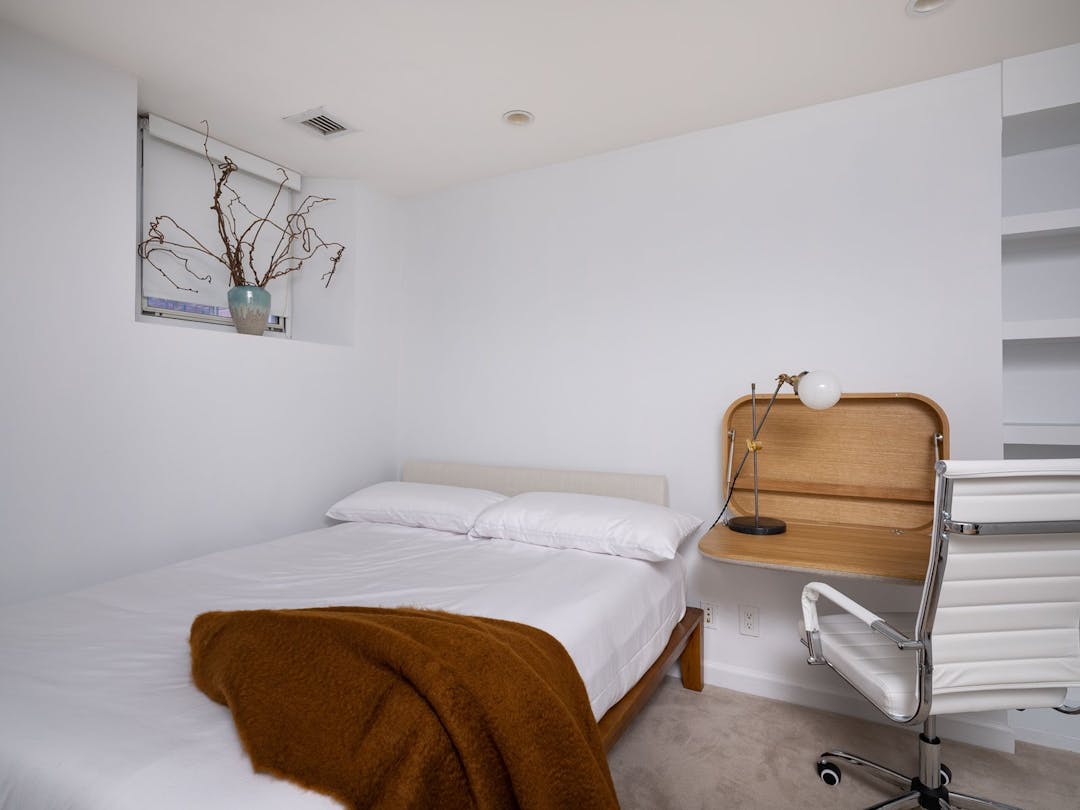
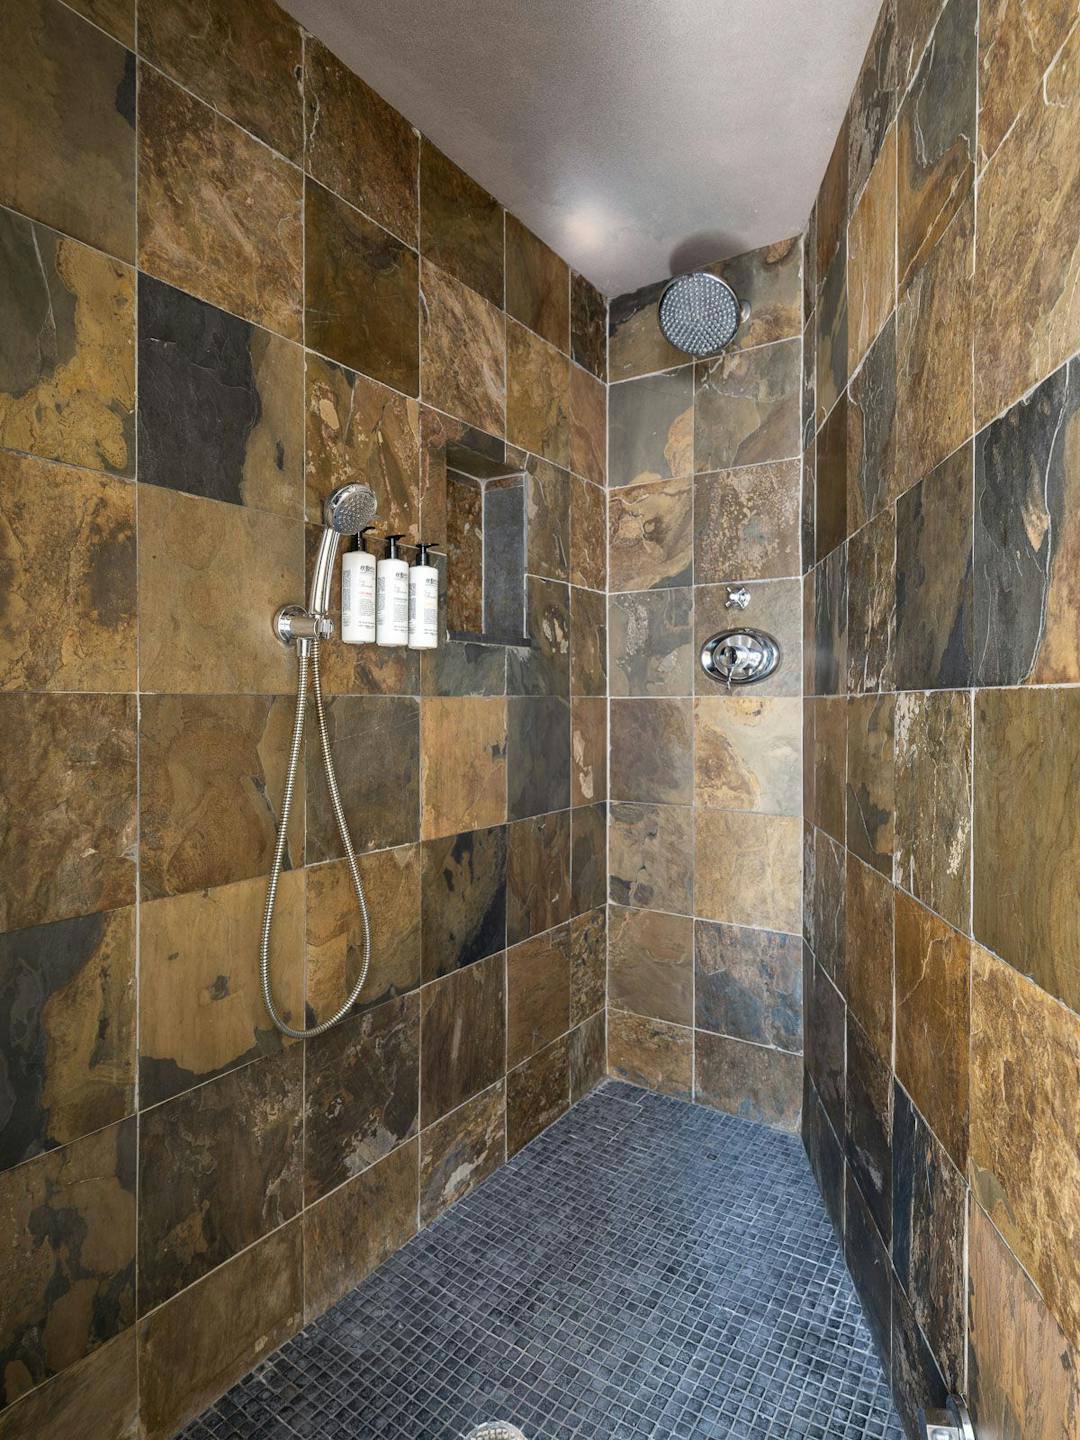
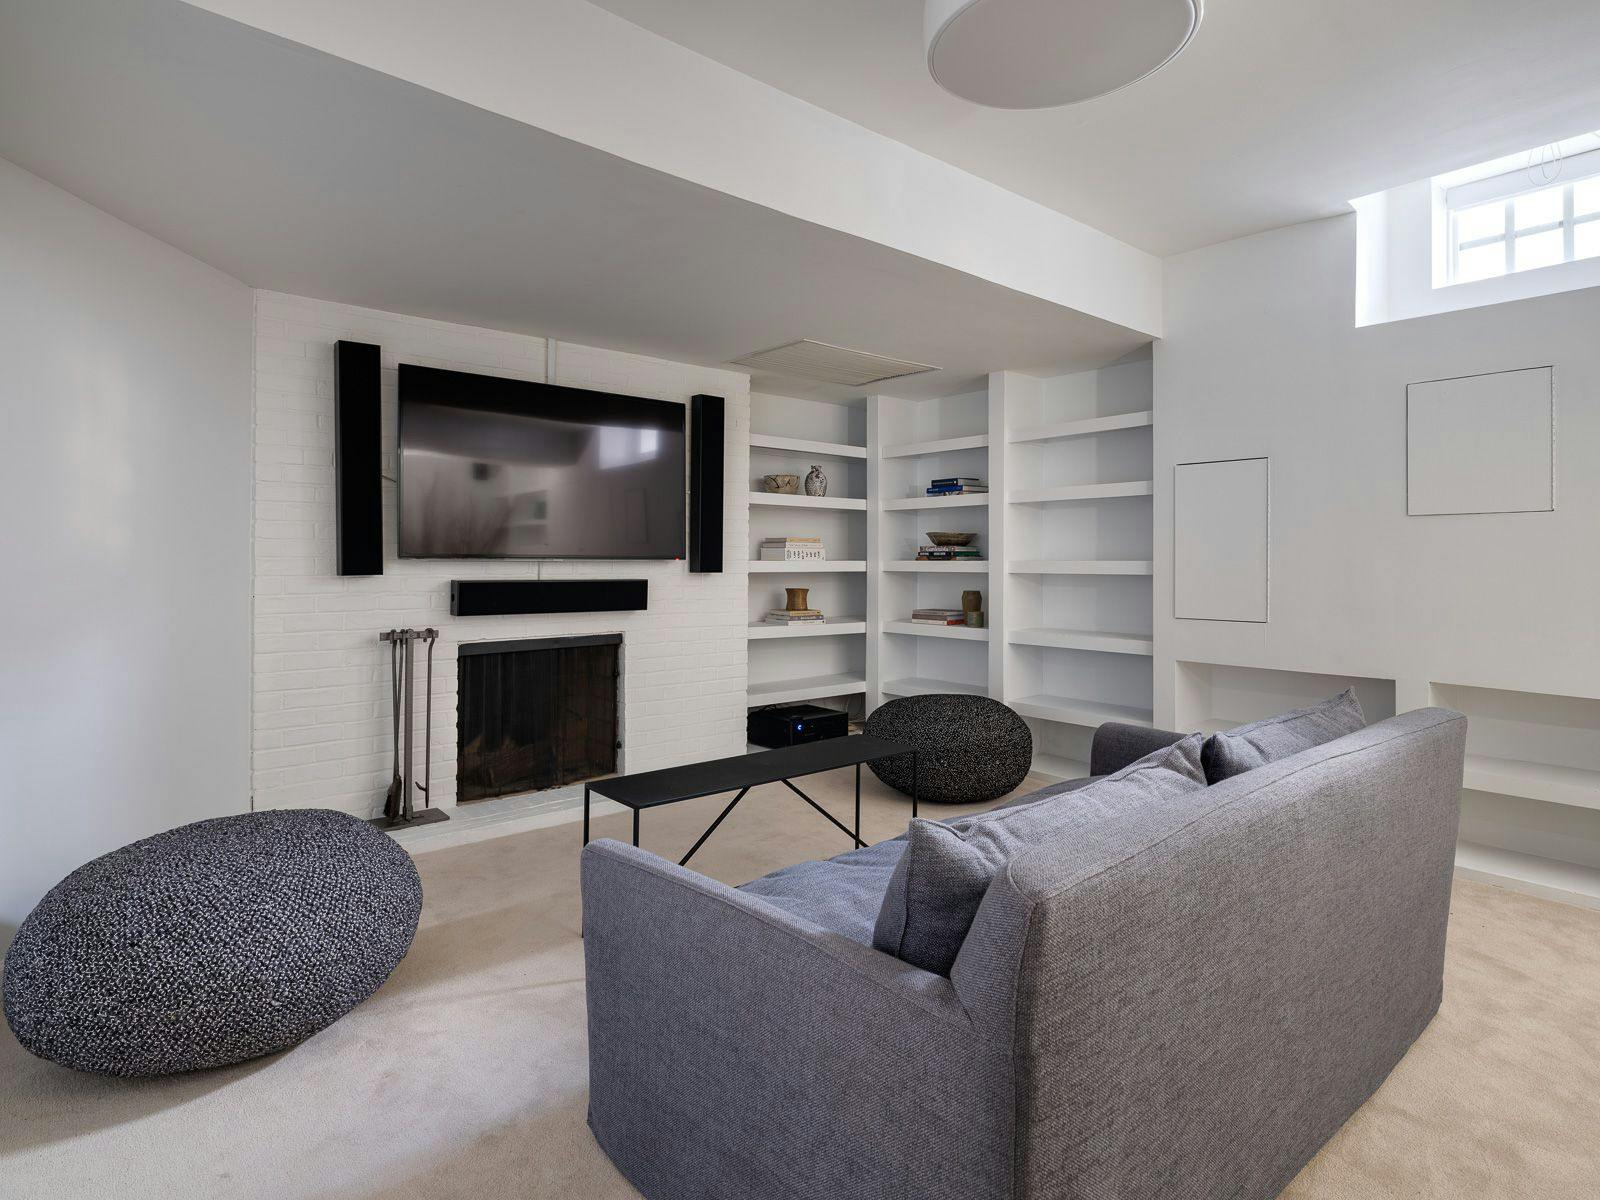
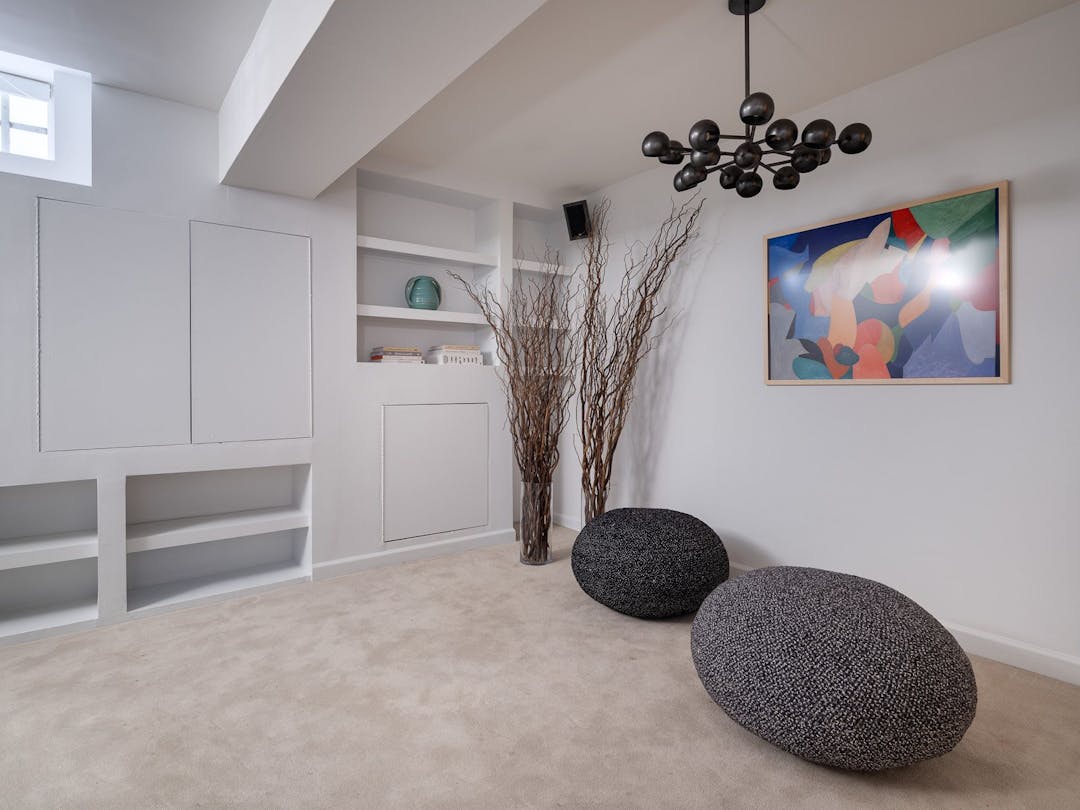
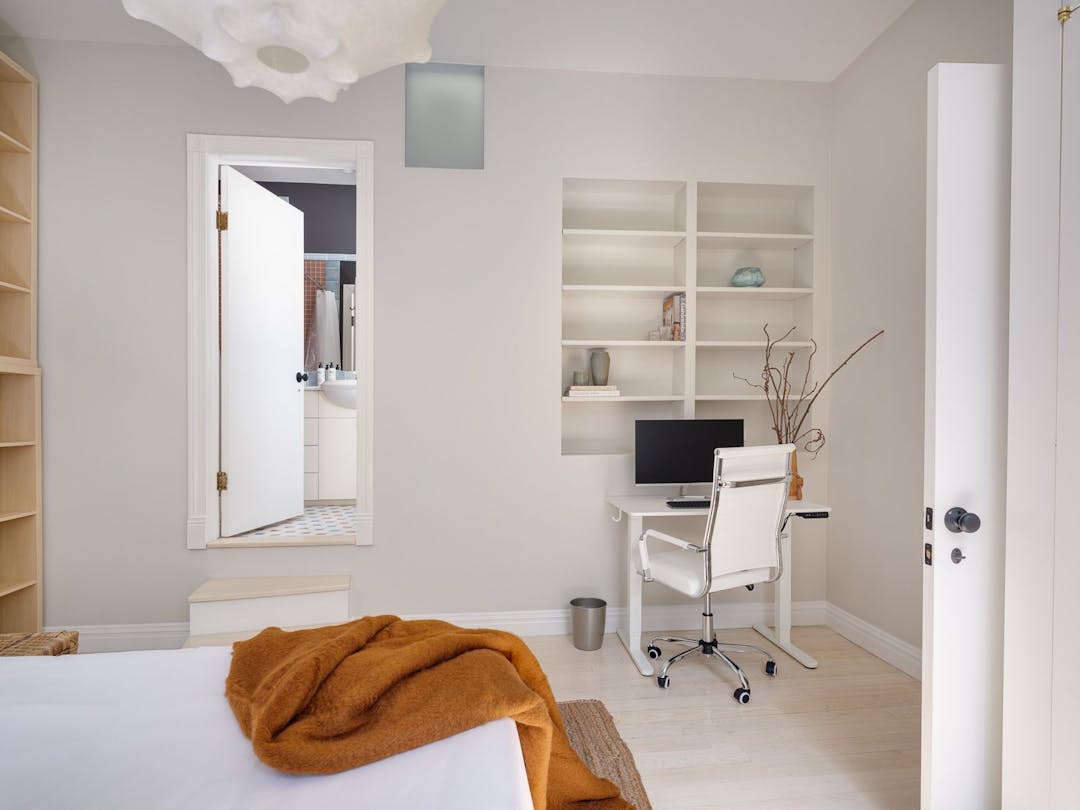
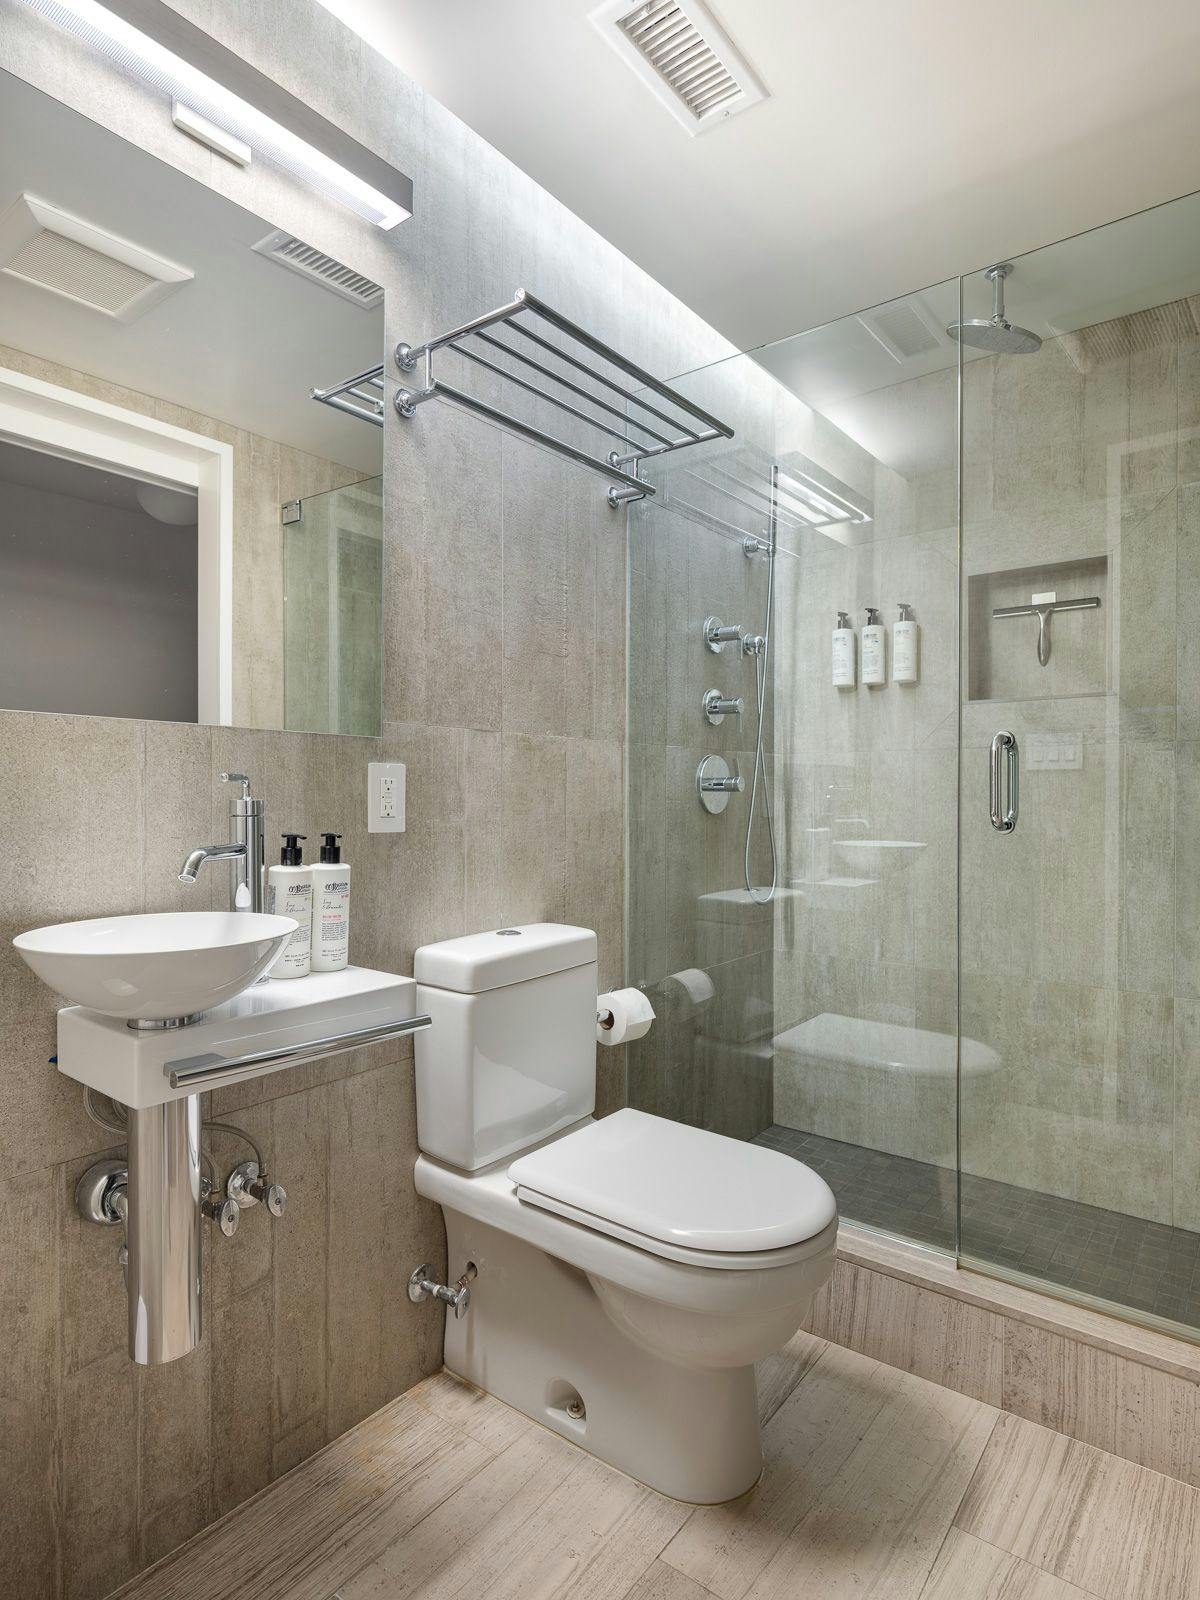
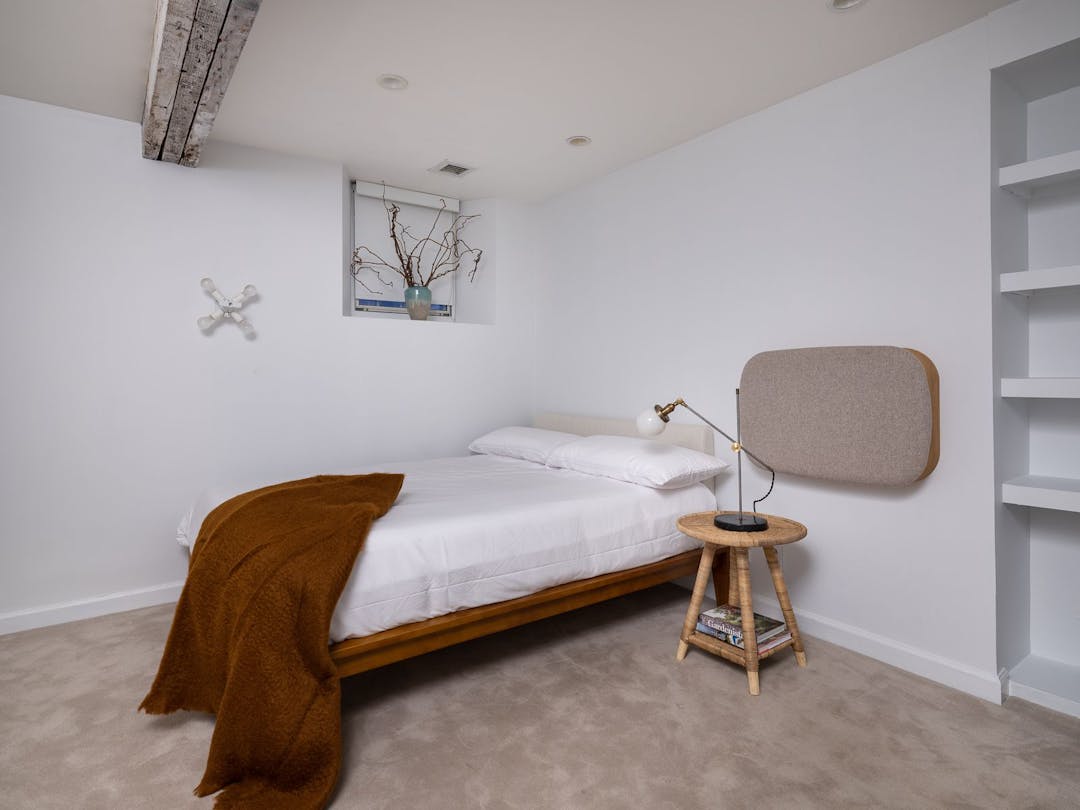
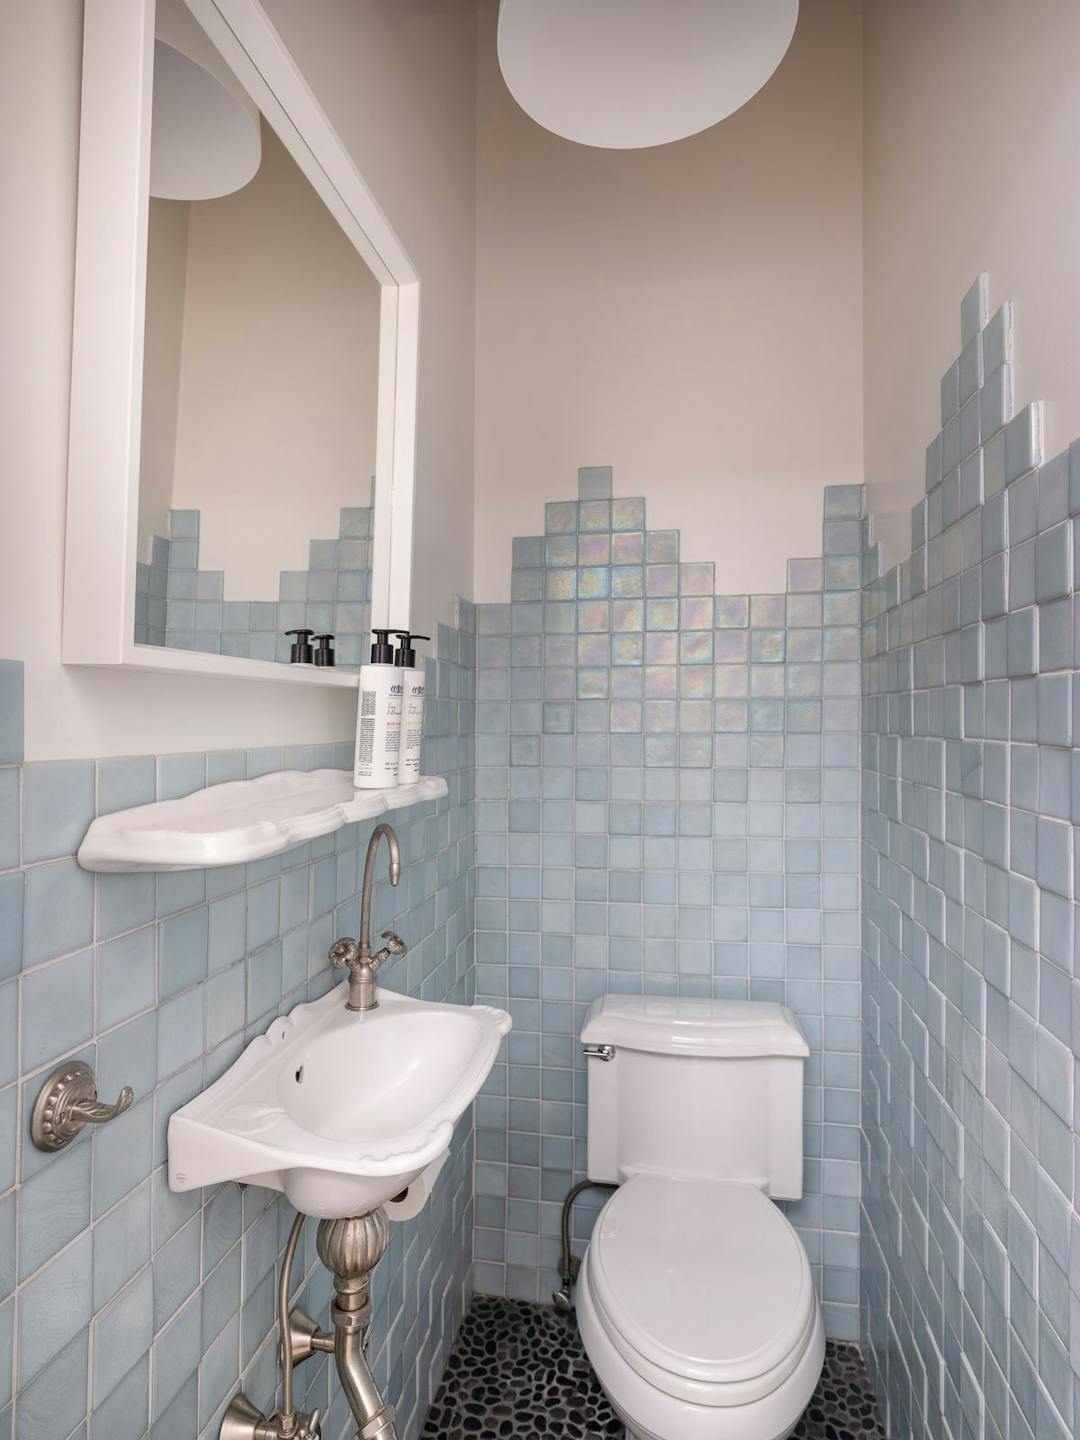
No detail has been overlooked; from the charming exposed brick, wood beams, white wood floors & window shutters, to the built-in bookcases, dual window treatments for sun & privacy.
Desirable Neighborhood
The neighborhood retail, food, transportation, and recreational amenity options are par none, just moments from the Greenwich Hotel, Whole Foods and so much more to the south in the newly evolved Financial District with its soon-to-open Ronald Perelman Performing Arts Center.
Home Inputs
Purchase Price

This is the Seller's advertised pice. Rove's policy is to not represent buyers on Partner Listing below 90% of the Advertised price.
Down Payment
The down payment is the cash portion of the property price at the time of purchase. The down payment is used to calculate return metrics.
$1,350,000
Weeks of Use
This is how many weeks you as the owner want to use the property.
4 weeks
Hold Period
This is the amount of time between buying and selling the home.
10 years
Appreciation
This is the home price appreciation forecast.
3.5%
Reset to default
Rove Automated Inputs
Rove Verified ADR

This is the average daily rent for the property when listed. It is an estimate based on Rove's comparable properties in the market and available data. It is not a prediction or guaranty of future rental income.
$1,300
Occupancy
Occupancy is an estimate based on Rove's comparable properties in the market and available data. It is not a prediction or guaranty of future rental income.
90%
Annual Income
Gross annual income estimate based on Rove's comparable properties in the market and available data. It is not a prediction or guaranty of future rental income.
$394,290
Annual Financial Summary
show
Outputs
Return on Investment
Total Return is your cash profit calculated as the sum of your estimated (i) annual net operating cash flows over the hold period, plus (ii) property net sale proceeds minus your initial investment and outstanding loan balance.
4.8x
Annualized Return
Annualized Return is a measure of annualized net return on an equity investment. It equals the discount rate at which the sum of the present value of all cash flows is zero. Calculation is based on actual and budgeted values.
15.3%
Cap Rate
Cap rate is the percentage return calculated by dividing net operating income in Year 1 by the property purchase price.
-4.3%
Carrying Cost
First year net carrying cost flow is the estimated dollar amount received after payment for property taxes, property management, repairs and maintenance, capital expenditures, and loan payments.
$268,291.13
Top Comparison Properties
Beds
4
Bath
4.5
Guests
10
007 Townhouse with Roof Deck


Revenue
$182,516
Revenue Potential
$215,719
Days Available
249
Occupancy
27%
ADR
$2,687

Beds
4
Bath
4
Guests
16
4 Elegant Deluxe Suites with Living Room! Offering sweeping views of NYC!
Revenue
$119,989
Revenue Potential
$161,676
Days Available
99
Occupancy
76%
ADR
$1,602

Beds
4
Bath
4
Guests
16
4 Elegant Deluxe Suites with Living Room! Offering sweeping views of NYC!
Revenue
$147,007
Revenue Potential
$205,575
Days Available
99
Occupancy
86%
ADR
$1,729

Beds
4
Bath
4
Guests
16
New York Botanical Garden Tour! 4 Pet-friendly Suites!
Revenue
$140,015
Revenue Potential
$183,587
Days Available
99
Occupancy
90%
ADR
$1,573
Beds
4
Bath
4
Guests
16
Comfortable Stay! 4 Pet Friendly Units! Parking, Close to Washington Square Park
Revenue
$142,461
Revenue Potential
$201,029
Days Available
99
Occupancy
83%
ADR
$1,724

Beds
4
Bath
4
Guests
16
New York Botanical Garden Tour! 4 Pet-friendly Suites!
Revenue
$159,720
Revenue Potential
$218,407
Days Available
99
Occupancy
91%
ADR
$1,782
Beds
4
Bath
4
Guests
16
4 Spacious Units! Parking, Pets Allowed Close to Elizabeth Street Garden!
Revenue
$107,238
Revenue Potential
$172,146
Days Available
93
Occupancy
68%
ADR
$1,699